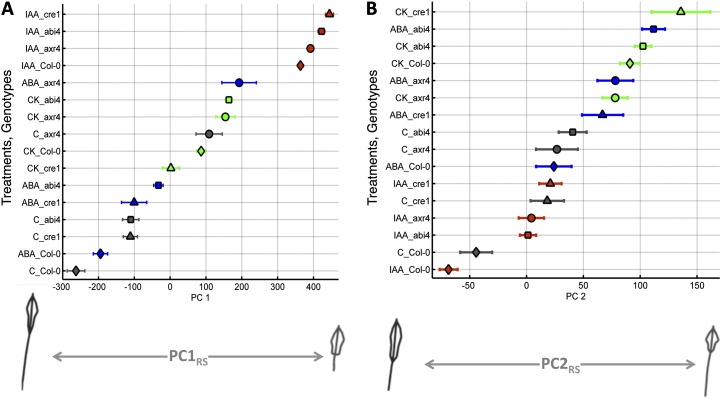
Figure 3.
Range of PC values obtained for Col-0 (diamonds) and three mutants, abi4-1 (squares), axr4-1 (circles), and cre1-2 (triangles), on the four different media (control [C], gray; IAA, red; CK, green; and ABA, blue) for the allometric Col-0 model. The mean of each genotype based on the four treatments is represented by a different shape, and the bars represent the se within the observed group. A, PC1. B, PC2. Extreme root shapes of minus or plus 1 sd are shown on each side below the x axis.

