Figure 5.
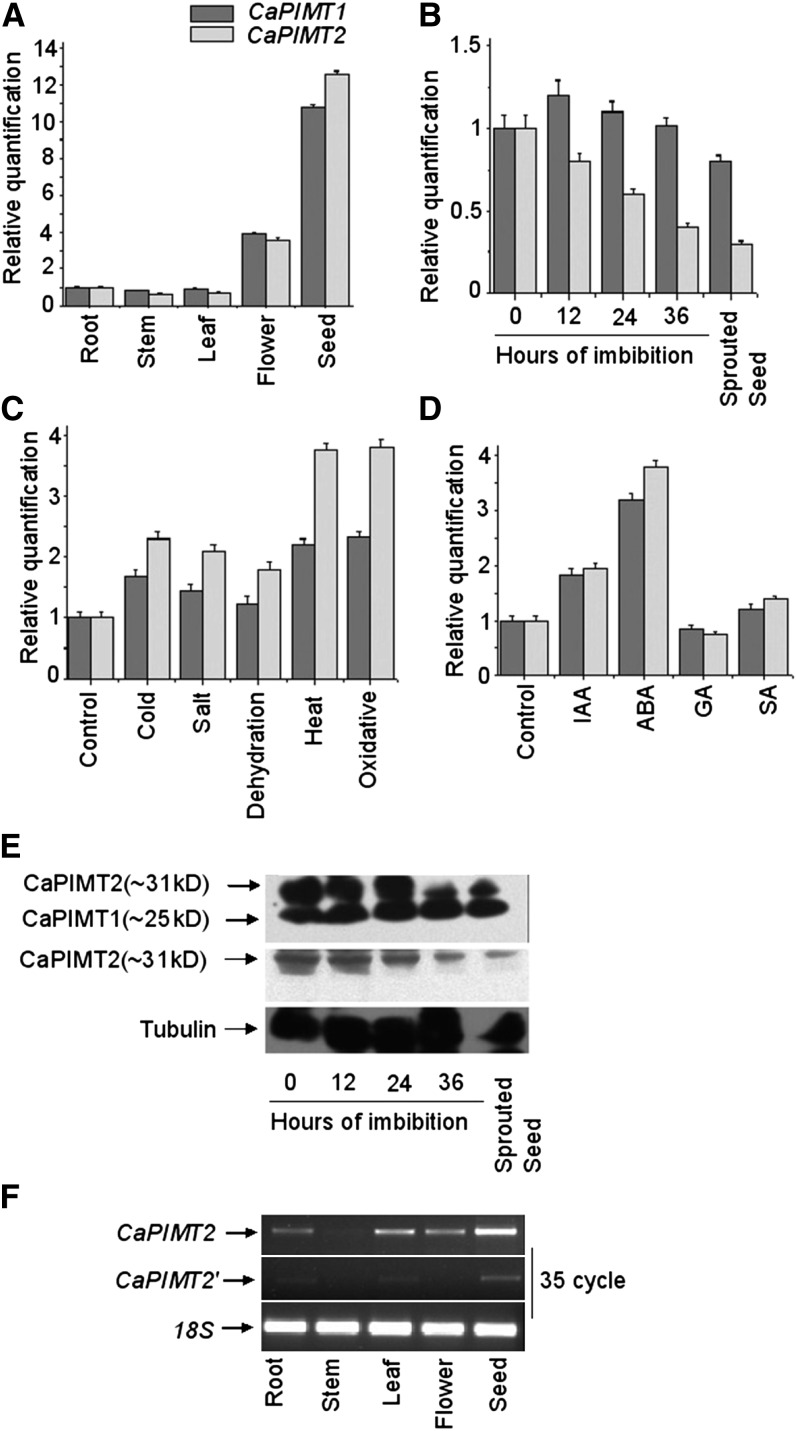
Expression analysis of CaPIMT1 and CaPIMT2. A to D, Quantitative real-time PCR analysis of CaPIMT1 and CaPIMT2 transcript abundance in different organs (A), during germination (B), under different stresses (C), and in the presence of different hormones (D). Total RNA from each sample was reverse transcribed and subjected to real-time PCR analysis. The relative expression value of each gene was normalized to an endogenous control (18S or β-actin) and calculated using the ΔΔCT method (Applied Biosystems). Values are the result of triplicate analyses of two biological replicates. Error bars indicate sd. IAA, Indole-3-acetic acid; SA, salicylic acid. E, Western-blot analysis of CaPIMT1 and CaPIMT2 in dry, imbibed, and sprouted seeds. Approximately 50 μg of total proteins was separated by 12% SDS-PAGE and probed with anti-PIMT (top panel) or anti-CaPIMT2 (middle panel) antibody. A similar blot was also probed with anti-tubulin antibody (bottom panel). F, Transcript analysis of CaPIMT2 and CaPIMT2′ in different organs through semiquantitative real-time PCR.

