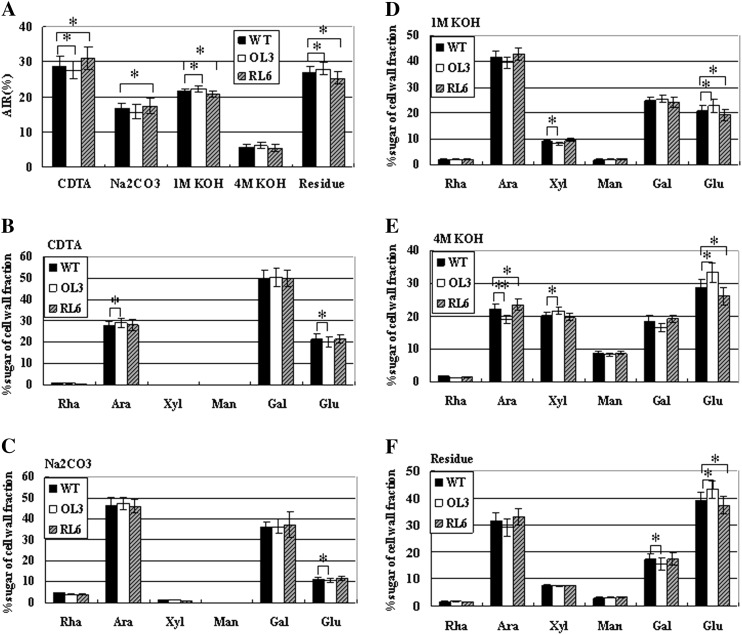
Figure 9.
Analysis of the sugar composition of cell wall fractions in 10-DPA fibers of transgenic cotton plants. The sugar composition of cell wall fractions was sequentially extracted with CDTA, Na2CO3, and 1 and 4 m KOH. Individual sugars Rha, Ara, Xyl, Man, Gal, and Glu are expressed as percentages of the cell wall fraction. Error bars show se (n = 3). OL3, GhFLA1 overexpression transgenic line 3; RL6, GhFLA1 RNAi transgenic line 6; WT, wild type. Independent Student’s t tests demonstrated that there was a significant difference (*P < 0.05) or a very significant difference (**P < 0.01) between transgenic lines and the wild type.

