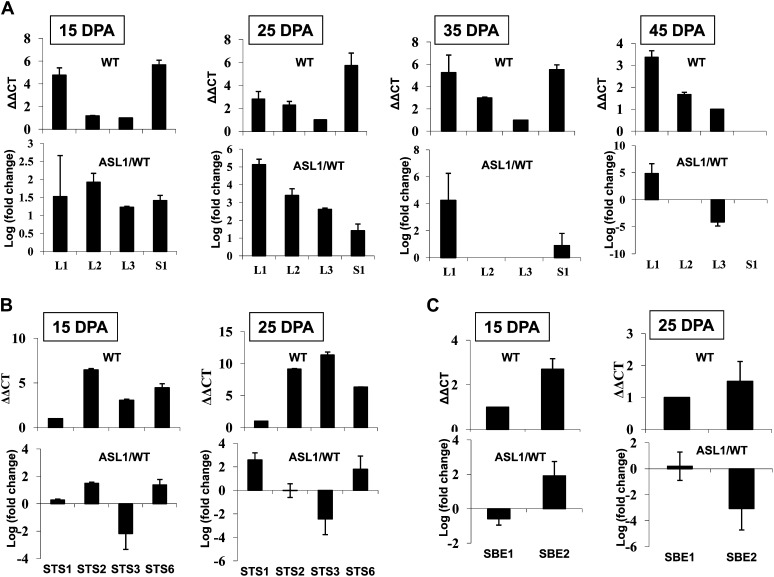
Figure 6.
Expression profile of SlAGPase genes in wild-type and ASL1 tomato fruits. The levels of transcripts were assessed in tomato fruit by qPCR at 15, 25, 35, and 45 DPA for (A) SlAGPaseL1 (L1), SlAGPaseL2 (L2), SlAGPaseL3 (L3), and SlAGPaseS (S1); at 15 and 25 DPA for (B) SlSTS1 (STS1), SlSTS2 (STS2), SlSTS3 (STS3) and SlSTS6 (STS6); and at 15 and 25 DPA for (C) SlSBE1 (SBE1) and SlSBE2 (SBE2). ΔΔCT refers to the fold difference in the expression of SlAGPase, SlSTS, and SlSBE relative to the isoforms L3, STS1, and SBE1, respectively. Levels of STS4, STS5, STS7, and SBE3 were not detectable. Log (fold change) refers to the expression of SlAGPase, SlSTS, and SlSBE isoforms in ASL1 relative to the expression of the same isoform in the wild type. The data represent mean values obtained with three replicates. WT, Wild type.

