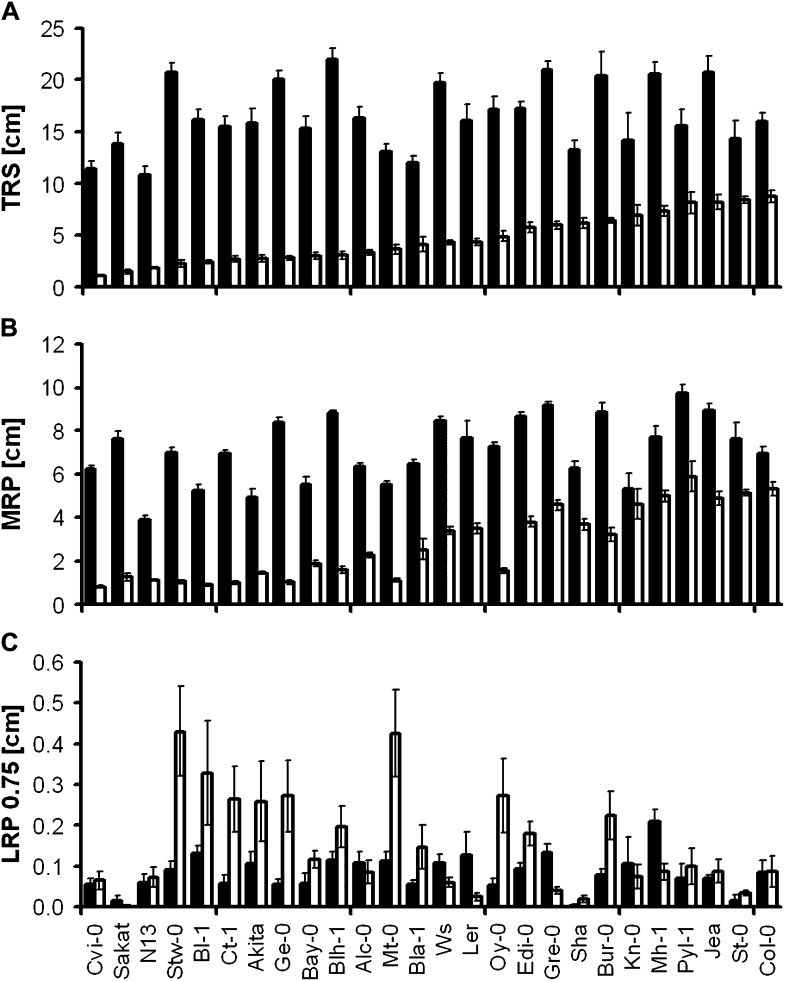
Figure 3.
K deficiency response of selected root parameters for individual genotypes. Means of TRS (A), MRP (B), and LRP 0.75 (C) were calculated from plants grown in control (black bars) and low-K (white bars) conditions. Accessions are sorted according to mean TRS in low K. Error bars indicate se (n = 7–12 plants per genotype per condition).

