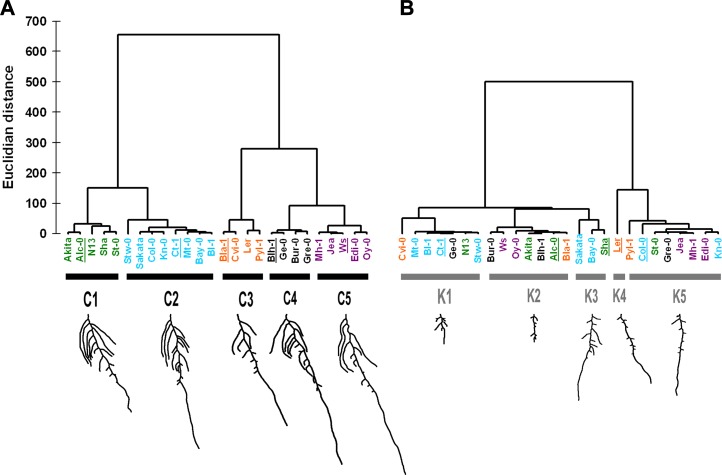
Figure 4.
AHC of natural accessions according to their overall root architecture highlights different response strategies to low K. All 14 quantified root traits of plants grown on control (A) and low-K (B) media were taken into account. Unweighted clustering was performed using Ward’s method for agglomeration and Euclidian distance for dissimilarity. Genotype names are colored according to cluster composition in the control condition. For each cluster, the phenotype of a representative accession (underlined) is shown below.

