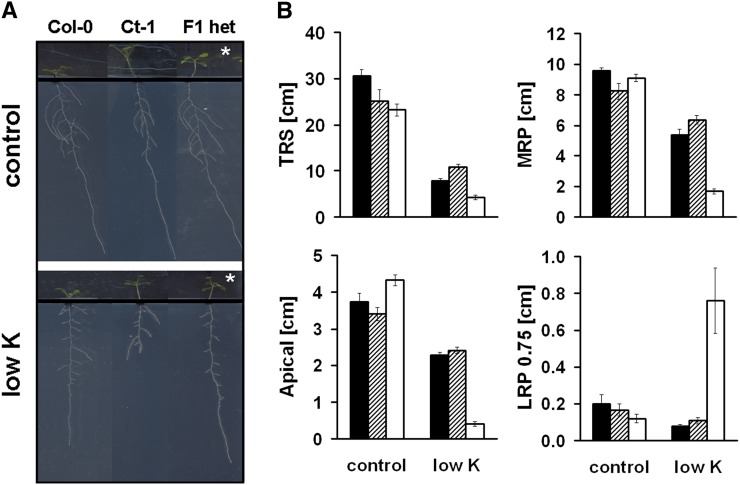
Figure 6.
The K starvation response of Col-0 is dominant over Ct-1. A, Representative images of Col-0, Ct-1, and heterozygous offspring of a Col-0 × Ct-1 cross (F1 het) grown on control or low-K medium (12 DAG). Note that F1 heterozygotes have elongated hypocotyls (asterisks), which is typical for Ct-1. B, Quantitative root parameters of F1 heterozygotes (dashed bars) confirm the dominance of the Col-0 phenotype (black bars) over Ct-1 (white bars). Crosses were performed in both directions with each accession as either the male or female partner, and data of both offspring were pooled for F1 heterozygotes (n = 13–22). [See online article for color version of this figure.]

