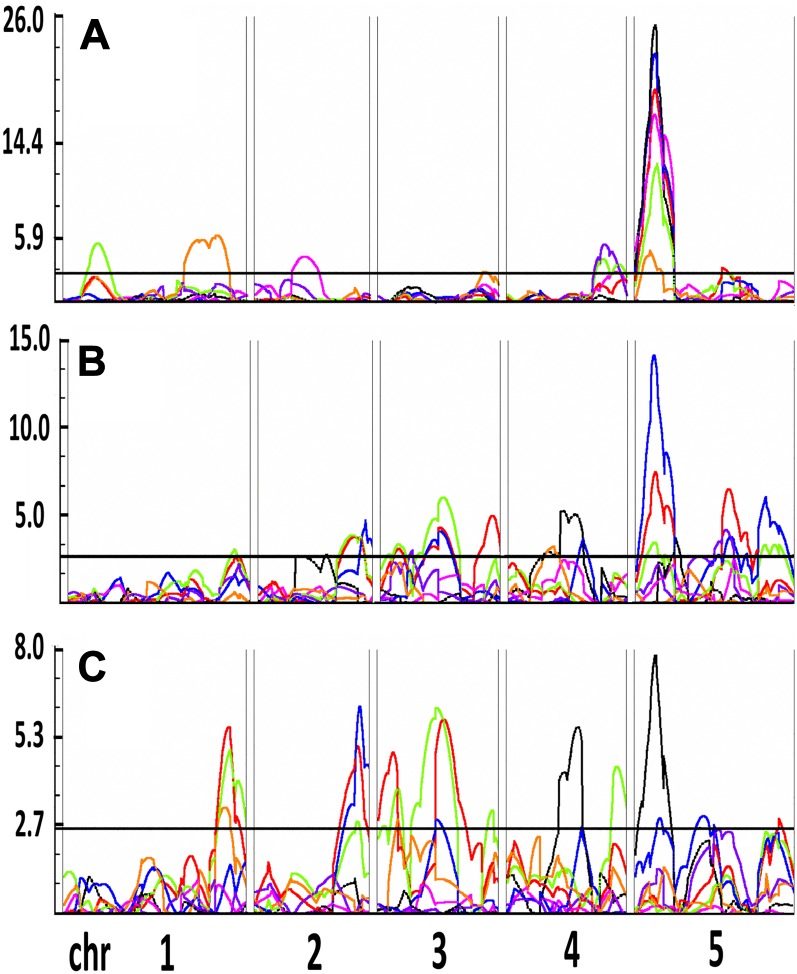
Figure 7.
QTL mapping of the K deficiency response in a Col-0 × Ct-1 RIL population. LOD profiles of selected parameters, MRP (red), MR angle (pink), Apical (green), TRS (blue), LRdensBZ (purple), LRP 0.25 (black), and LRP 0.75 (orange), are shown using root parameters quantified in control (A) and low-K (B) media and low K/control ratio (C) as input. The QTL threshold was determined with 1,000 random permutations of the phenotypic data set and is shown as a horizontal black line. Chromosomes 1 to 5 (chr 1– 5) are shown from left to right, separated by double lines. LOD score values are shown on the y axis.

