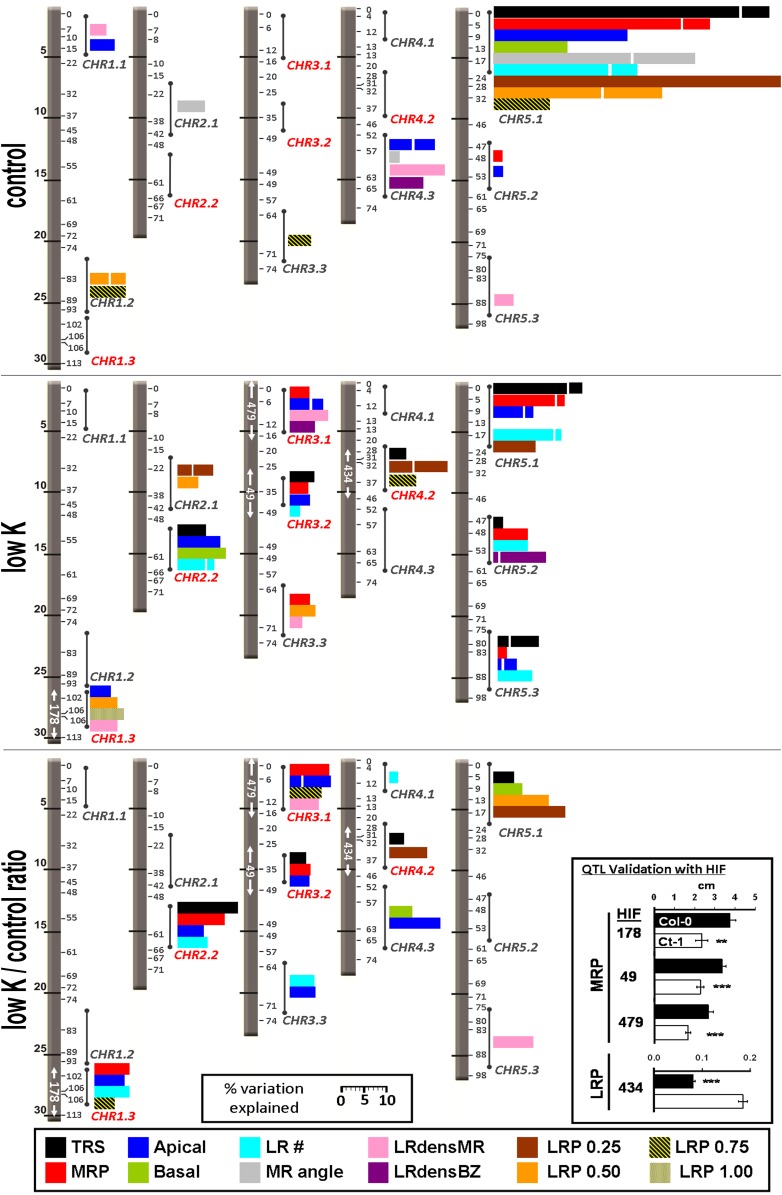
Figure 8.
Positions and effects of root architecture QTLs for control and low-K conditions. Results of multiple interval mapping analysis of 12 root parameters are shown for control (top panel) and low-K (middle panel) media and for the low K/control ratio (bottom panel). The five Arabidopsis chromosomes are shown as gray bars with physical distances (Mb) on the left and genetic distances (centimorgan) on the right. Colored bars give the percentage of phenotypic variation explained by the QTLs within a certain chromosome region (indicated by circles and sticks). Each color corresponds to a root parameter according to the legend provided at the bottom of the graph. Stacked bars of the same color show individual contributions from multiple QTLs within the region. Identifiers of low-K-specific regions (e.g. CHR1.3) are in red. White arrows inside the chromosomes highlight areas for which a QTL was confirmed by HIF analysis. The numbers identify the HIF for which significant (**P < 0.01, ***P < 0.001) phenotypic segregation was achieved, as shown in the box at the bottom right of the graph (Col-0 allele in black, Ct-1 allele in white).

