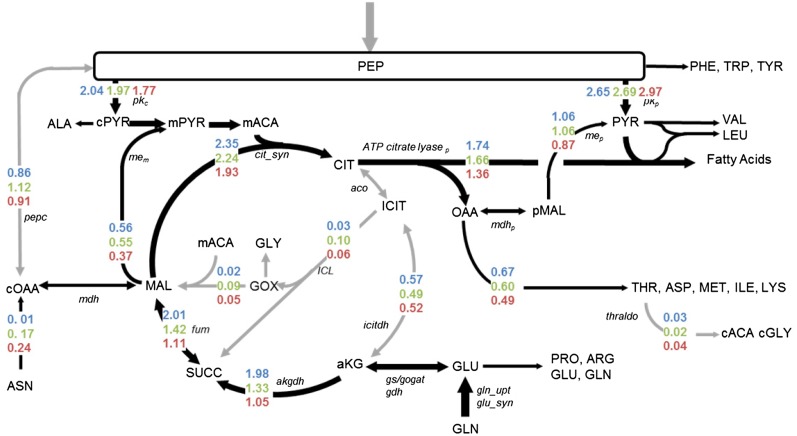
Figure 5.
Metabolic flux maps of developing soybean embryos supplied three different C:N ratios. The values have units of micromoles of metabolite per milligram dry weight produced. For easy visualization, arrows that are increased in thickness and darkness emphasize differences in fluxes. Colored numbers indicate the fluxes from the 13:1 (blue), 21:1 (green), and 37:1 (red) C:N ratios. Flux values that changed most significantly are provided in Table V, and a complete list of all fluxes, 95% CIs, and a flux map that includes metabolism into phosphoenolpyruvate is provided in Supplemental Data Set S7. Metabolite abbreviations are in uppercase letters, and key enzymes are indicated in italics.

