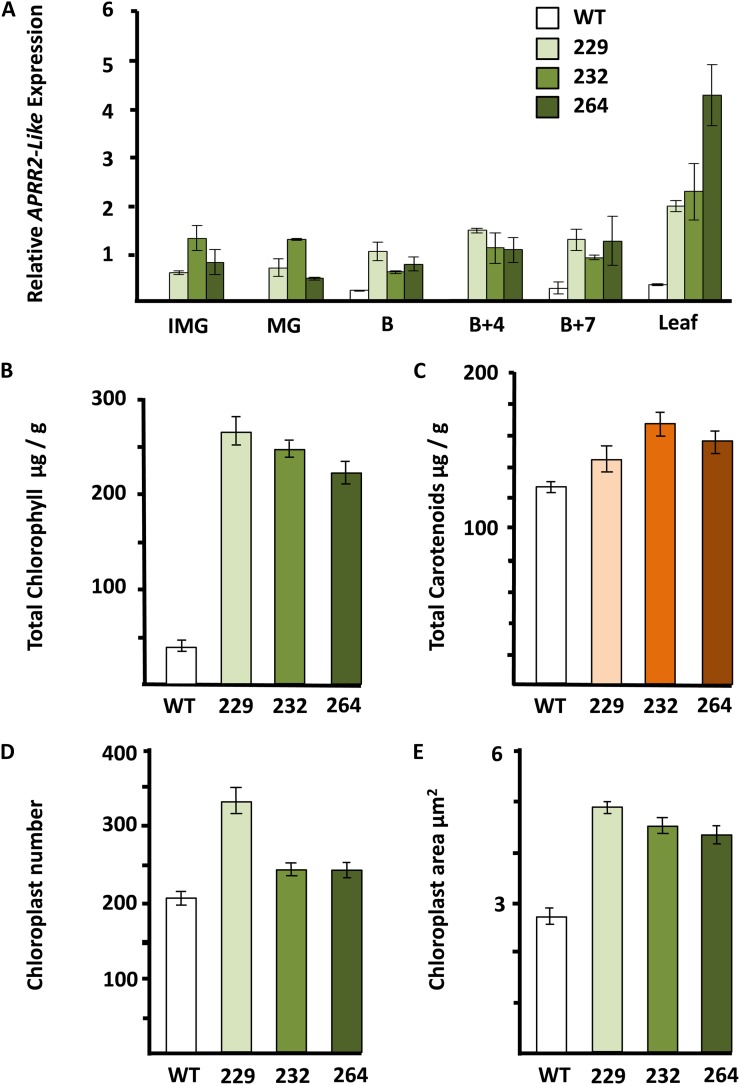
Figure 3.
Effects of APPR2-Like overexpression in transgenic cv Micro-Tom lines on pigment accumulation, chloroplast number, and area. A, Relative APRR2-Like expression. Fruit stages are as defined in Figure 2. B, Total chlorophyll at MG. C, Total carotenoids at breaker + 7 d. D, Chloroplast number at MG. E, Chloroplast area at MG. These parameters are shown for the wild type (WT) and three transgenic lines (229, 232, and 264). Error bars indicate se; n = 3 fruits from each line at each developmental stage.

