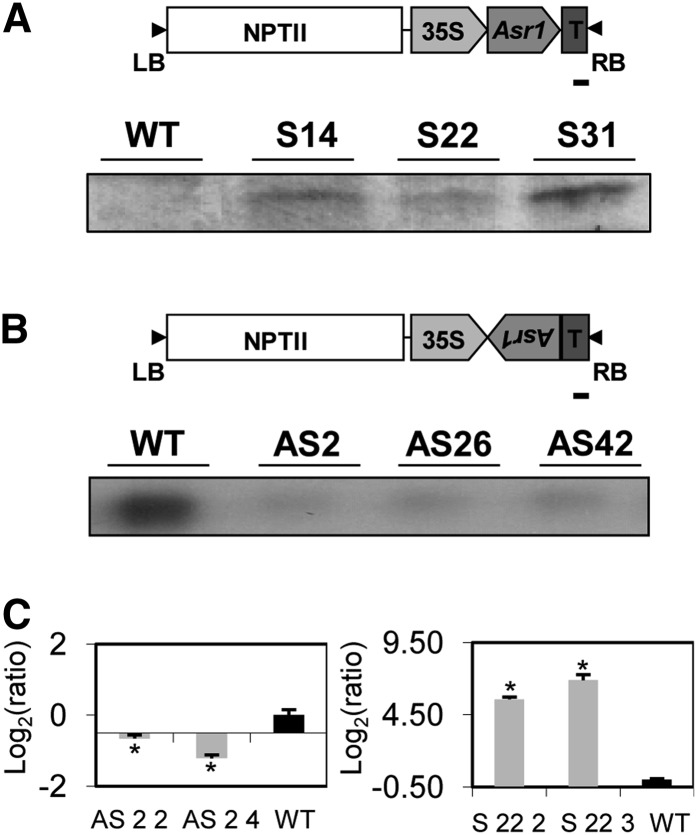
Figure 1.
Asr1 expression in tobacco transgenic lines. Western- (A) and northern-blot (B) analyses of three overexpressing (S) and three silenced (AS) transgenic lines (T0). Schemes of the constructs used for plant transformation are shown in the top side of each figure. Bars = 100 bp. C, qRT-PCR expression analyses in source leaves from T4 homozygous lines (left, antisense plants; right, overexpressing plants). Asterisks indicate statistically significant differences by the permutation test (P < 0.05). n = 3 to 5. WT, Wild type.

