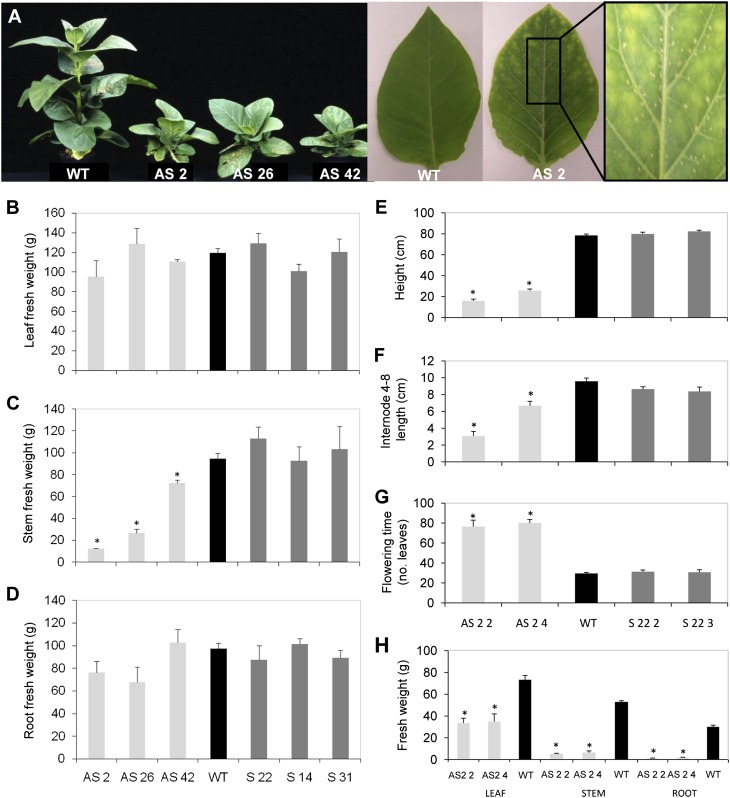
Figure 2.
Phenotypic characterization of the Asr1 transgenic lines. A, Visual phenotype of 6-week-old plants of three independent T0 silenced transgenic lines (left). Expanded seventh leaves from a wild-type (WT) plant and a T4 homozygous silenced plant (AS 2 4; right). Fresh matter accumulated in leaves (B), stems (C), and roots (D) of independent T0 transgenic lines. Phenotypic characterization of T4 homozygous lines: plant height (E), internode 4 to 8 length (F), flowering time measured as the number of total leaves of the plant at the time of the setting of flower buds (G), and matter accumulation in leaves, stems, and roots (H). Data represent the means ± se of measurements from five to eight plants per line. Asterisks indicate statistically significant differences by Student’s t test (P < 0.05). AS, Silenced plants; S, overexpressing plants. [See online article for color version of this figure.]

