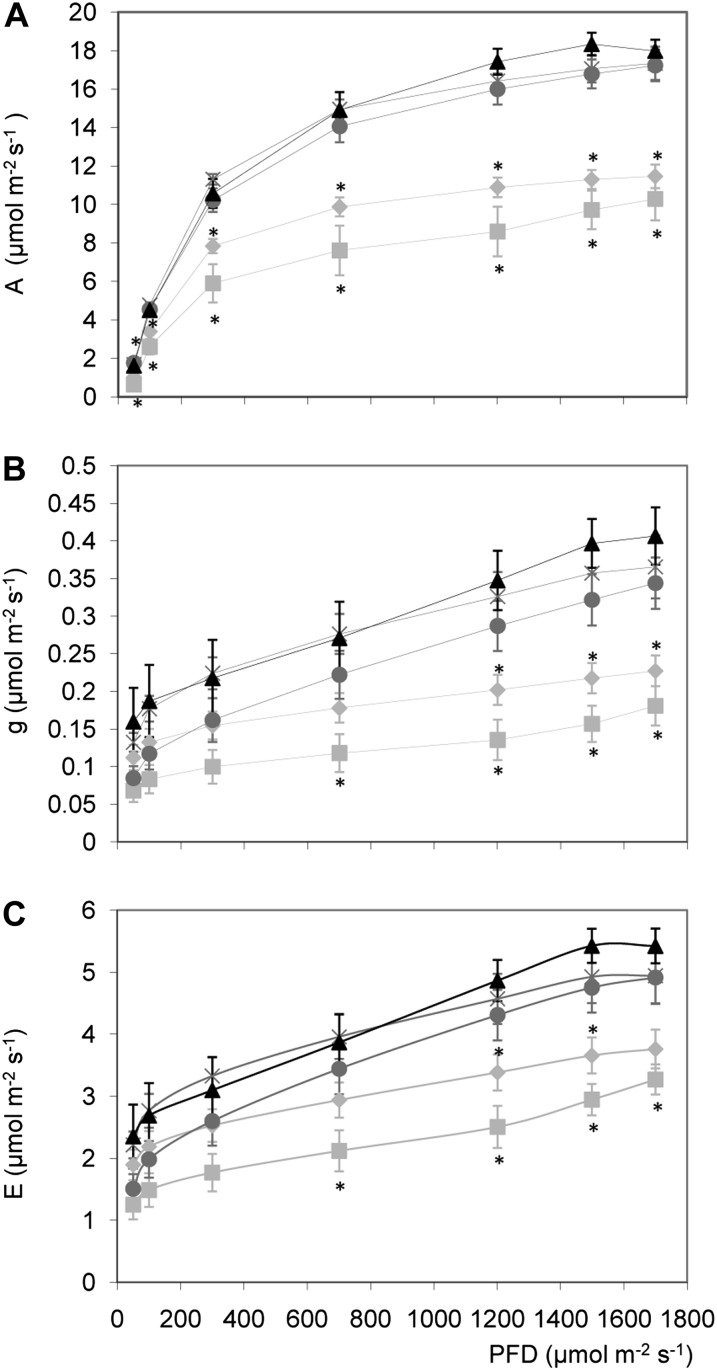
Figure 3.
Effect of altered Asr1 expression on photosynthetic parameters of T4 plants. A, CO2 assimilation rate or A; B, stomatal conductance or G; and C, transpiration rate or E, measured at the indicated photon flux density (PFD) in fully expanded leaves of T4 plants at vegetative stage. Light-gray squares, AS 2 2; light-gray rhombuses, AS 2 4; black triangles, wild type; dark-gray circles, S 22 2; dark-gray crosses, S 22 3. The data represent the mean ± se of measurements from four to six plants per line. Asterisks indicate statistically significant differences by Student’s t test (P < 0.05).

