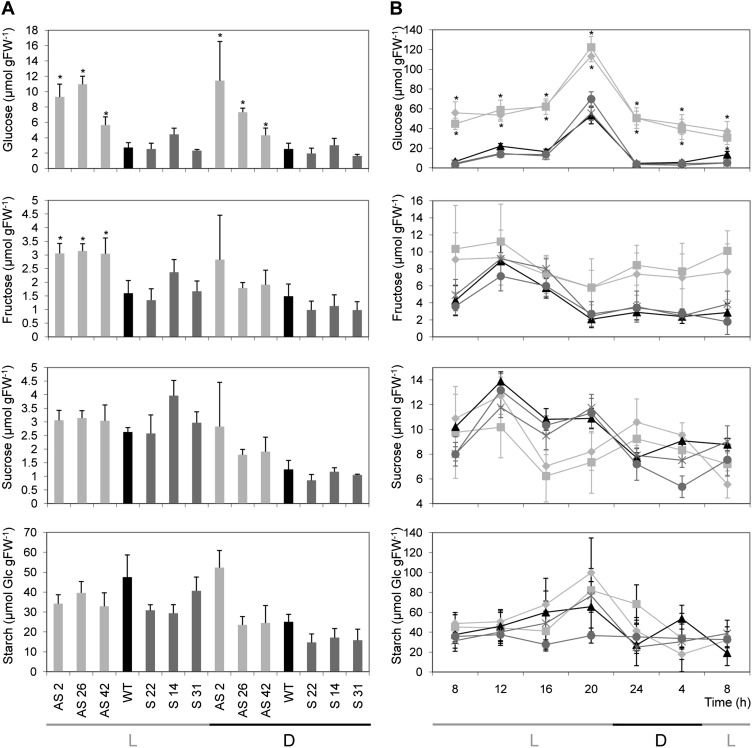
Figure 4.
Leaf carbohydrate contents in Asr1 transgenic lines. A, Carbohydrate contents in source leaves of T0 plants at a light time point (1 pm) and a dark time point (5 am). B, Diurnal changes in carbohydrate contents in leaves from T4 homozygous plants. At each time point, samples were taken from mature source leaves and data represent the means ± se of measurements from four to six plants per line. L, Light period; D, dark period; FW, fresh weight. Light-gray squares, AS 2 2; light-gray rhombuses, AS 2 4; black triangles, wild type (WT); dark-gray circles, S 22 2; dark-gray crosses, S 22 3. Asterisks indicate statistically significant differences relative to wild-type controls by Student’s t test (P < 0.05).

