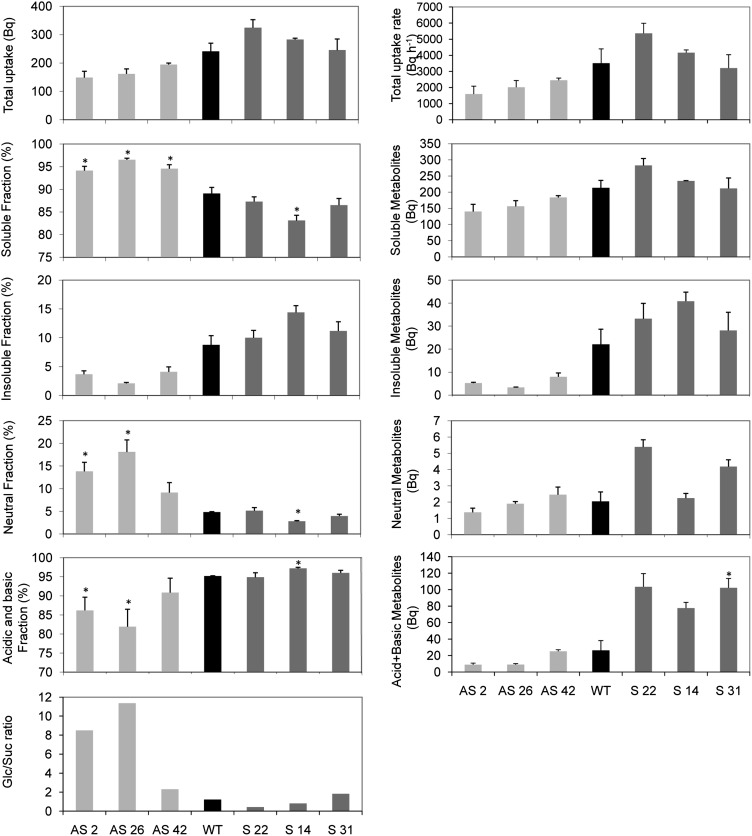
Figure 5.
Glc assimilation in Asr1 transgenic leaves (T0). Leaf discs were cut from 6-week-old plants at the onset of the light period and incubated with [U-14C]Glc. Soluble and insoluble fractions were measured in a scintillation counter. Soluble fractions were subsequently separated by ion-exchange chromatography. Total [U-14C]Glc uptake and soluble, insoluble, neutral, acid, and basic fractions are shown on the left. Total uptake rate, absolute soluble, insoluble, neutral, acid, and basic metabolites are shown on the right. Sugars from neutral fractions were separated on TLC plates, and Glc-to-Suc ratios are presented at bottom left. Data represent the mean ± se of measurements from three plants per line. Asterisks indicate statistically significant differences by Student’s t test (P < 0.05). WT, Wild type.

