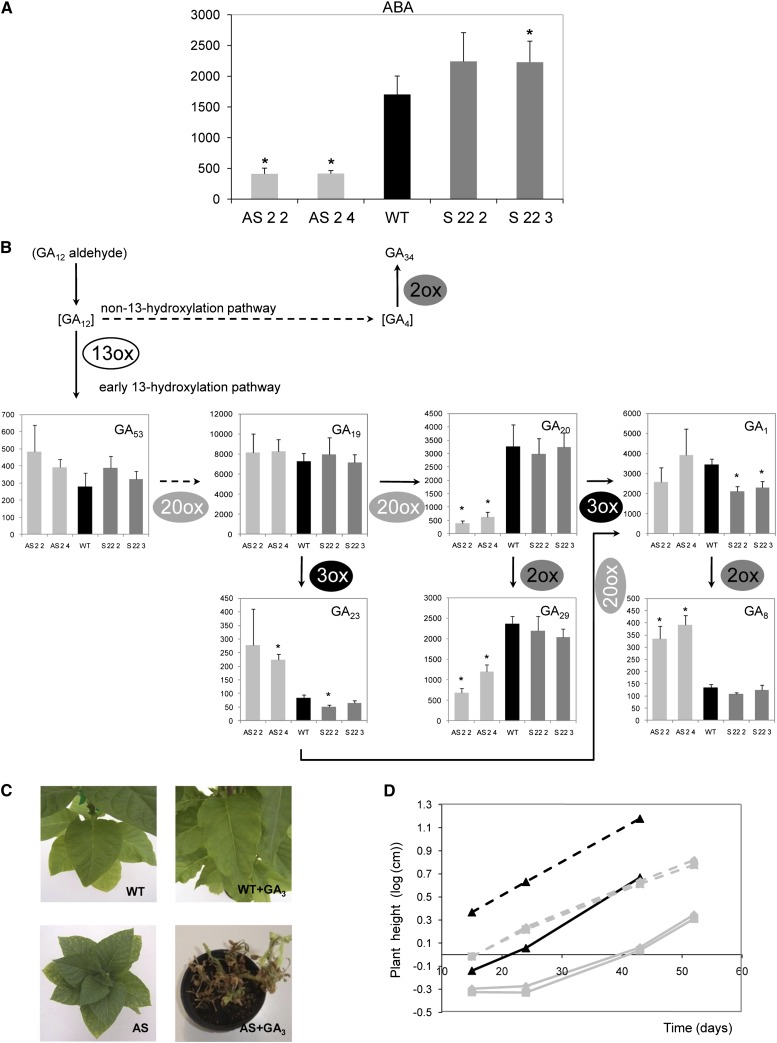
Figure 6.
ABA and GA metabolism in Asr1 tobacco plants and GA3 sensitivity of Asr1-silenced plants. ABA (A) and GA (B) levels were measured by LC-MS/MS in source leaves from 6-week-old plants. ABA and GA data are expressed in ng g dry weight−1 and pg g dry weight−1, respectively, and represent the means ± se of measurements from five independent plants per line. Asterisks indicate statistically significant differences compared with wild-type (WT) controls by Student’s t test (P < 0.05). Species in brackets were not detected. GA34 was convincingly detected, but levels were below the reliable level of quantification. Reconstruction of GA pathway was done based by Yamaguchi (2008) and MacMillan (1997). Continuous and dashed lines indicate single and multiple reactions, respectively. 13ox, 13-Oxidase; 20ox, 20-oxidase; 3ox, 3-oxidase; 2ox, 2-oxidase. Exogenous GA3 (10 μm) was applied to young seedling as described in “Materials and Methods.” Pictures of GA3-treated (right) and untreated (left) silenced transgenics (T4) and control plants (C). Plant height along growth (D). Gray squares, AS 2 2; gray triangles, AS 2 4; black triangles, wild type; continuous lines, untreated plants; dashed lines, treated plants. [See online article for color version of this figure.]

