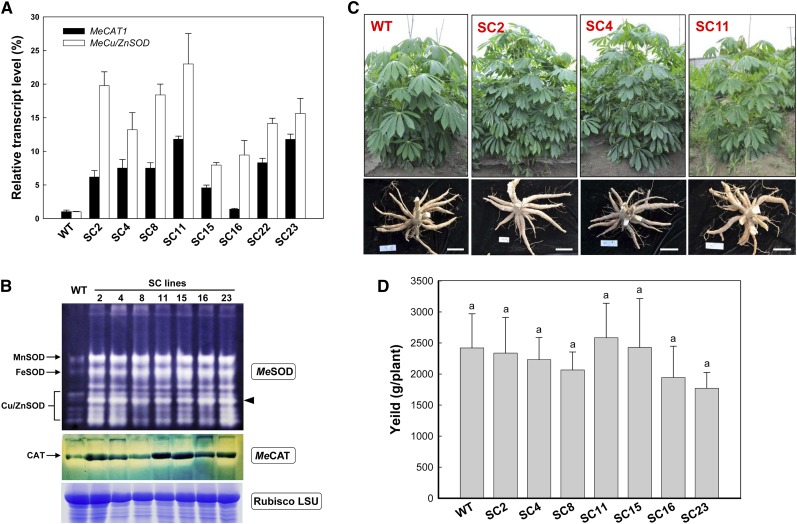
Figure 1.
Analyses of cassava SOD and CAT transcript and abundance and phenotypic evaluation of transgenic plants harvested from the field. A, qRT-PCR analysis of MeCu/ZnSOD and MeCAT1 expression levels both in wild-type (WT) and transgenic cassava. Total RNA was extracted from leaves, and the data are shown relative to the wild type, using β-actin as an internal control. Data are presented as means ± sd of three independent RNA samples. B, SOD and CAT isoforms in leaves of wild-type and transgenic plants detected by activity staining of a nondenaturing polyacrylamide gel. Three SOD isoforms, MnSOD, FeSOD, and Cu/ZnSOD, are indicated. A substantial increase of the cytoplasmic Cu/ZnSOD is highlighted by the black arrowhead. The Rubisco LSU protein was used as a loading control. C and D, Normal growth of transgenic plants with fully developed storage roots (C) and unchanged yield (D) in comparison with the wild type in the field. Bars = 15 cm. No significant difference was found by Duncan’s multiple comparison tests at P < 0.05. [See online article for color version of this figure.]

