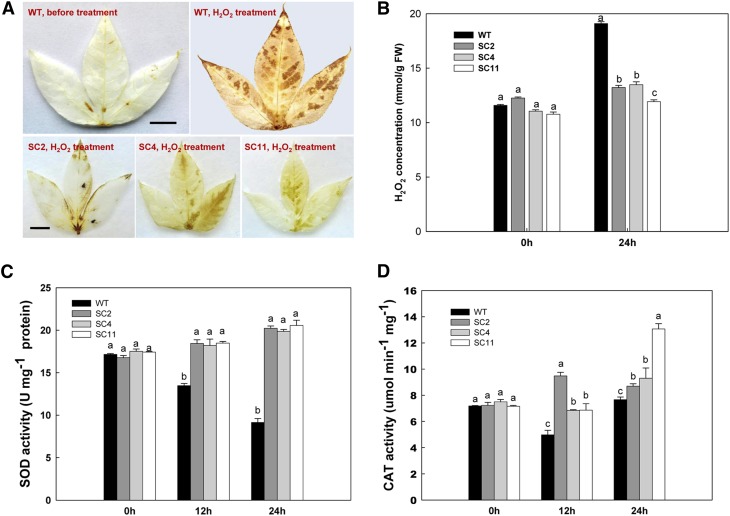
Figure 3.
Enhanced tolerance to H2O2-mediated oxidative stress in transgenic leaves. A, H2O2 accumulation in leaves detected by DAB staining. Bars = 0.5 cm. B, Changes in the levels of H2O2 concentration between wild-type (WT) and transgenic cassava during 0.5 m H2O2 treatment. C and D, Changes in SOD (C) and CAT (D) activities between wild-type and transgenic cassava during H2O2 treatment. Values represent means of three independent experiments ± sd. Values labeled with different letters (a, b, and c) are significantly different by Duncan’s multiple comparison tests at P < 0.05. [See online article for color version of this figure.]

