Fig. 4.
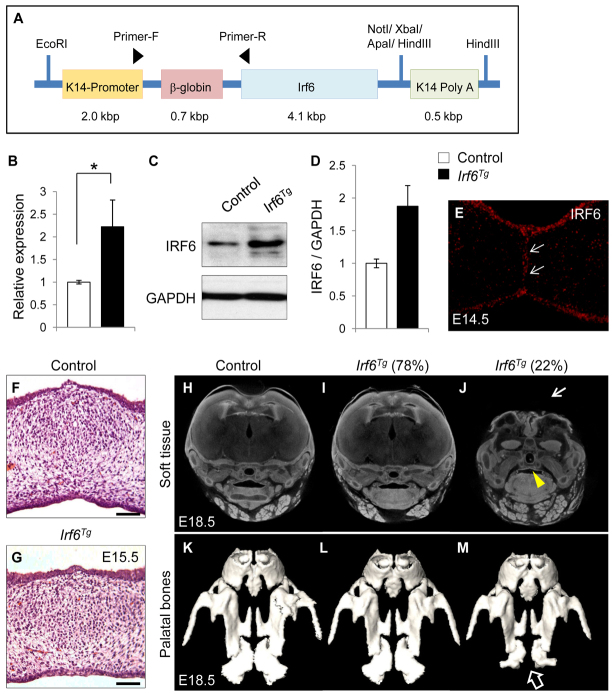
Generation of K14-Irf6 transgenic mice. (A) Construct used to generate K14-Irf6 transgenic mice. (B) Quantitative RT-PCR analyses of Irf6 in the palates of control and K14-Irf6Tg mice at E14.5. n=6 per genotype. *P<0.05. (C) Immunoblotting analysis of IRF6 in the MEE of control and K14-Irf6Tg mice. GAPDH was used as a loading control. (D) Bar graph shows the ratio of IRF6 per GAPDH following quantitative densitometry analysis of immunoblotting data. Three samples were analyzed. (E) Immunohistochemical analysis of IRF6 in the palate of E14.5 K14-Irf6Tg mice. Arrows indicate IRF6 expression in the MEE. (F,G) H&E staining of littermate control (F) and K14-Irf6 transgenic (Irf6Tg; G) mice at E15.5. Scale bars: 50 μm. (H-J) MicroCT analysis of the soft tissues of E18.5 control (H) and K14-Irf6Tg (I,J) mice. Seventy-eight percent of K14-Irf6Tg mice exhibit apparently normal development (I), and 22% exhibit severe craniofacial deformities (J). Arrowhead indicates palatal fusion in the K14-Irf6Tg mice with severe craniofacial deformities. Arrow indicates calvarial defect in the K14-Irf6Tg mice. (K-M) MicroCT analysis of the hard tissue of E18.5 control mice (K) and K14-Irf6Tg mice with normal development (L) or with severe craniofacial deformities (M). Arrow indicates hypoplasia of the palatine bones in K14-Irf6Tg mice with severe craniofacial deformities. Error bars represent s.d.

