Fig. 7.

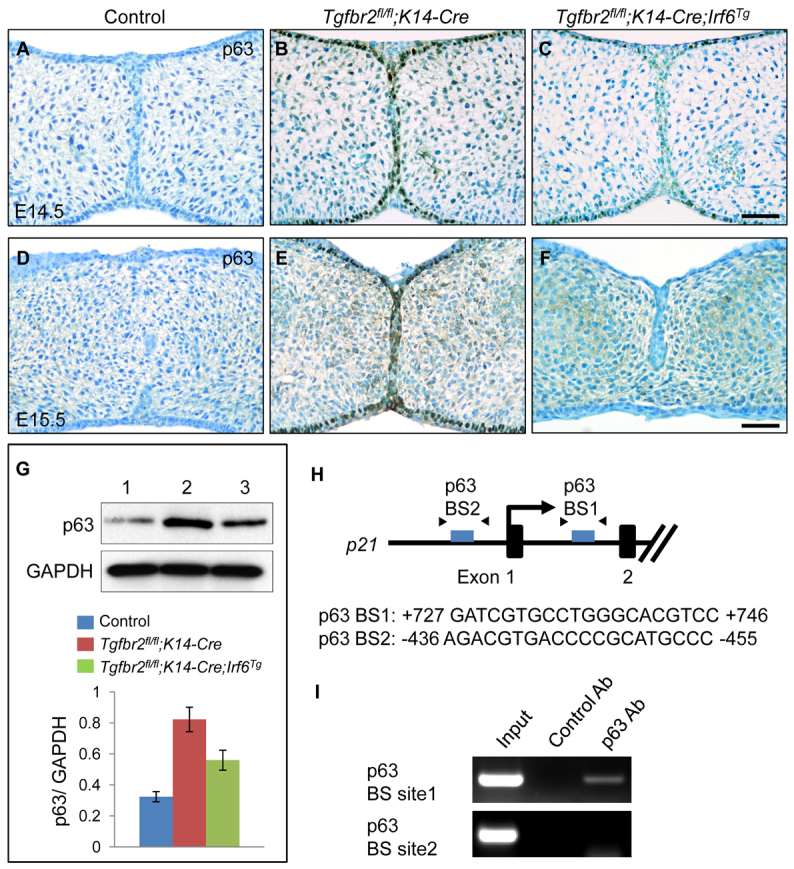
Increased ΔNp63 expression in Tgfbr2fl/fl;K14-Cre mice. (A-F) Immunohistochemical analyses of ΔNp63 expression in the palates of Tgfbr2fl/fl control (A,D), Tgfbr2fl/fl;K14-Cre (B,E) and Tgfbr2fl/fl;K14-Cre;Irf6Tg (C,F) mice at E14.5 (A-C) and E15.5 (D-F). Brown, positive signal. Nuclei were counterstained with 0.03% Methylene Blue. Scale bars: 50 μm. (G) Immunoblotting analysis of p63 in the MEE of E14.5 Tgfbr2fl/fl control (lane 1), Tgfbr2fl/fl;K14-Cre (lane 2) and Tgfbr2fl/fl;K14-Cre;Irf6Tg (lane 3) mice. GAPDH was used as a loading control. Bar graph (below) shows the ratio of p63 to GAPDH following quantitative densitometry analysis of immunoblotting data. Three samples were analyzed. (H) Schematic of the upstream region of the mouse p21 gene (not to scale), showing locations of putative p63-binding sites tested in ChIP assays. Putative p63-binding sequences are shown below. Arrowheads indicate the position of primers used in ChIP analysis. (I) ChIP analysis of DNA fragments immunoprecipitated with a p63-specific antibody or with an isotype-specific control antibody. Immunoprecipitates were PCR amplified with primers flanking the putative p63-binding region. Input lane shows PCR amplification of the sonicated chromatin before immunoprecipitation. No amplification of target sites was detected when an isotype-specific control antibody was used. Ab, antibody; BS, binding site.
