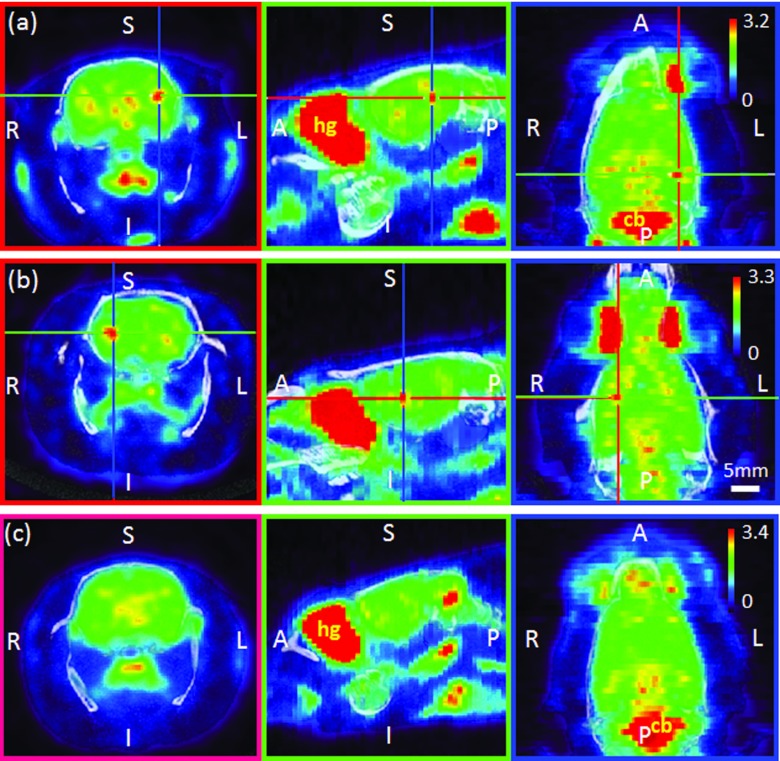
Figure 4.
Examples of PET/CT images: Sonication was given on the left (a) or right (b) hemisphere, whereas (c) shows the images from the control condition (i.e., no sonication). The crosshairs in (a) and (b) indicate the location of the center of the acoustic focus. Coronal (first column)/sagittal (second column)/transversal (third column) planes. The vertical bar in the transversal plane indicates pseudocoloring scale of the SUV range. The orientation notations represent the anatomical directions (A: anterior, P: posterior, S: superior, I: inferior, R: right, L: left). Apart from the sonication site, the Harderian gland (hg) and cerebellum (cb) showed relatively higher FDG uptake. The horizontal bar indicates the mm scale, which applies to all images.

