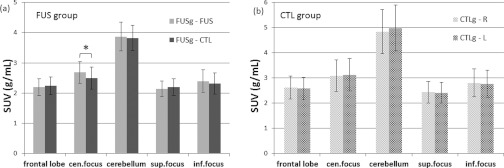
Figure 5.

Comparison in SUV within group: (a) experimental group (FUSg), (b) control group (CTLg). Multiple VOIs were drawn in multiple anatomical regions: frontal lobe, center of acoustic focus (cen.focus), cerebellum, superior to the center of acoustic focus (sup.focus), and inferior to the center of acoustic focus (inf.focus). The asterisk indicates statistically significant differences (paired t-test; p < 0.05). The error bars indicate ±1 s.e.m.
