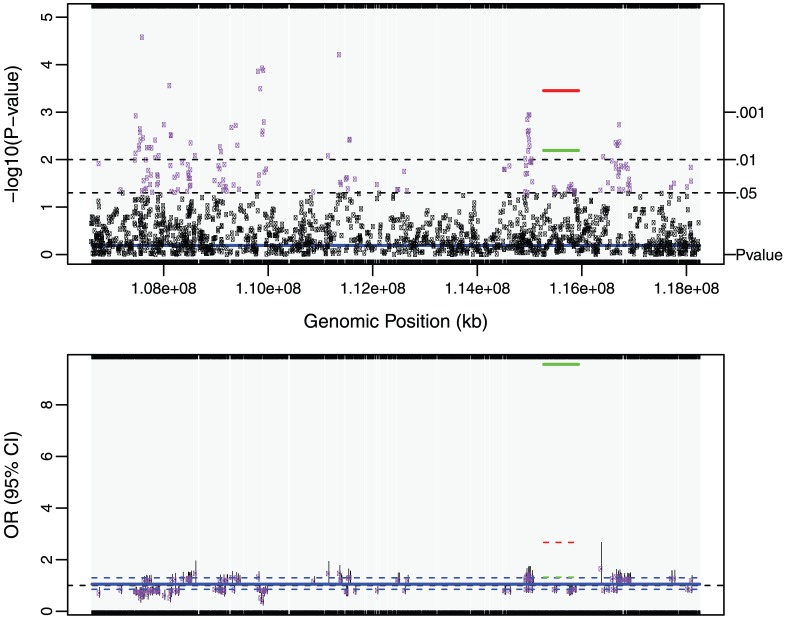
Figure 3. gTOH (rs7812989-rs2884258) and aTOH (rs7812989-rs2884258) regions associated with lung cancer.
(A) –log10 transformed p-values obtained from the association tests. The green line, red line and blue line are the p-values corresponding to gTOH (rs7812989-rs2884258), aTOH (rs7812989-rs2884258) region and their parent cTOH region, respectively. The purple dots and black dots are p-values<0.05 and > = 0.05 based on single SNP association tests within the same region of the parent cTOH. (B) The corresponding lung-cancer risks as odds ratios (OR) and 95% confidence interval (CI). Green solid line and dash line corresponding to OR and 95%CI for gTOH, while red and blue lines are for aTOH and it’s parent cTOH. The purple dots represent OR for single SNP risk with grey solid vertical lines showing the 95% CIs.

