
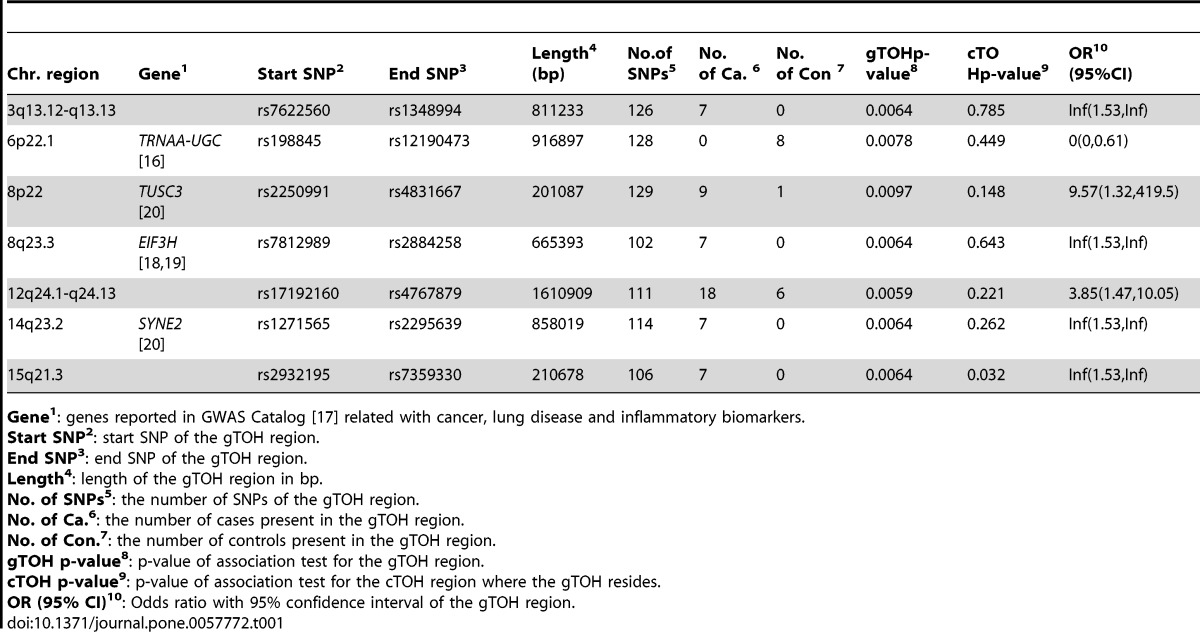
Table 1. gTOHs significantly associated with lung cancer.
| Chr. region | Gene1 | Start SNP2 | End SNP3 | Length4(bp) | No.ofSNPs5 | No.of Ca. 6 | No.of Con 7 | gTOHp-value8 | cTOHp-value9 | OR10(95%CI) |
| 3q13.12-q13.13 | rs7622560 | rs1348994 | 811233 | 126 | 7 | 0 | 0.0064 | 0.785 | Inf(1.53,Inf) | |
| 6p22.1 | TRNAA-UGC [16] | rs198845 | rs12190473 | 916897 | 128 | 0 | 8 | 0.0078 | 0.449 | 0(0,0.61) |
| 8p22 | TUSC3 [20] | rs2250991 | rs4831667 | 201087 | 129 | 9 | 1 | 0.0097 | 0.148 | 9.57(1.32,419.5) |
| 8q23.3 | EIF3H [18],[18] | rs7812989 | rs2884258 | 665393 | 102 | 7 | 0 | 0.0064 | 0.643 | Inf(1.53,Inf) |
| 12q24.1-q24.13 | rs17192160 | rs4767879 | 1610909 | 111 | 18 | 6 | 0.0059 | 0.221 | 3.85(1.47,10.05) | |
| 14q23.2 | SYNE2 [20] | rs1271565 | rs2295639 | 858019 | 114 | 7 | 0 | 0.0064 | 0.262 | Inf(1.53,Inf) |
| 15q21.3 | rs2932195 | rs7359330 | 210678 | 106 | 7 | 0 | 0.0064 | 0.032 | Inf(1.53,Inf) |
Gene1: genes reported in GWAS Catalog [17] related with cancer, lung disease and inflammatory biomarkers.
Start SNP2: start SNP of the gTOH region.
End SNP3: end SNP of the gTOH region.
Length4: length of the gTOH region in bp.
No. of SNPs5: the number of SNPs of the gTOH region.
No. of Ca.6: the number of cases present in the gTOH region.
No. of Con.7: the number of controls present in the gTOH region.
gTOH p-value8: p-value of association test for the gTOH region.
cTOH p-value9: p-value of association test for the cTOH region where the gTOH resides.
OR (95% CI)10: Odds ratio with 95% confidence interval of the gTOH region.
doi:10.1371/journal.pone.0057772.t001