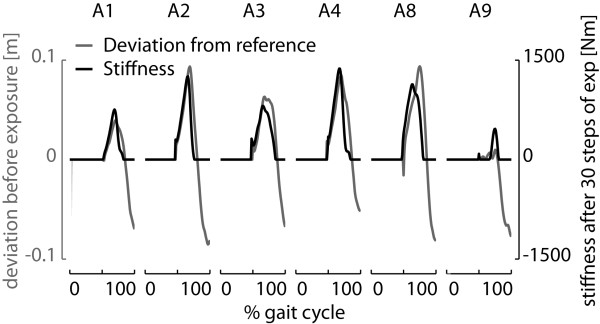
Figure 12.

Shape of the stiffness profile after convergence. The figure shows the initial deviation of the ankle from the reference trajectory (gray) together with the converged stiffness profile (black). For all patients, the stiffness shaped according to the initial deviation from the reference.
