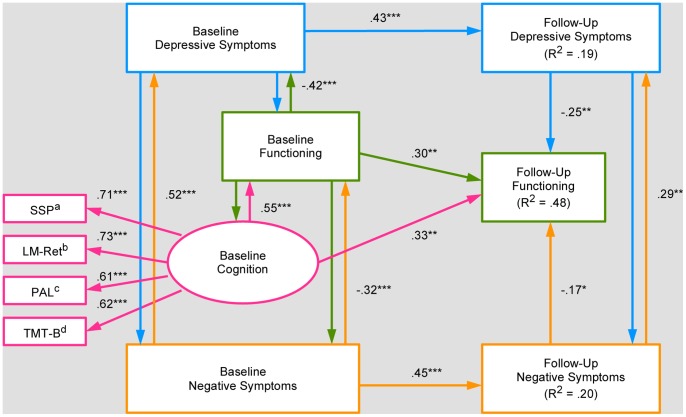
Figure 1. Final structural equation model.
Note: Rectangles denote measured variables. Ovals denote latent variables. Single-headed arrows represent regression paths. Two single-headed arrows pointing in opposite directions represent correlations. Residual error terms for all endogenous variables were omitted for ease of viewing. SSP = Spatial Span length. LM-Ret = Logical Memory percentage retention. PAL = Paired Associates Learning adjusted errors. TMT-B = Trail Making Test – Part B. Depressive and Negative Symptoms were measured by subscales from the expanded Brief Psychiatric Rating Scale, and Functioning was measured by the Social and Occupational Functioning Assessment Scale. aR2 = .50. bR2 = .54. cR2 = .37. dR2 = .39. *p≤.05. **p≤.01. ***p≤.001.

