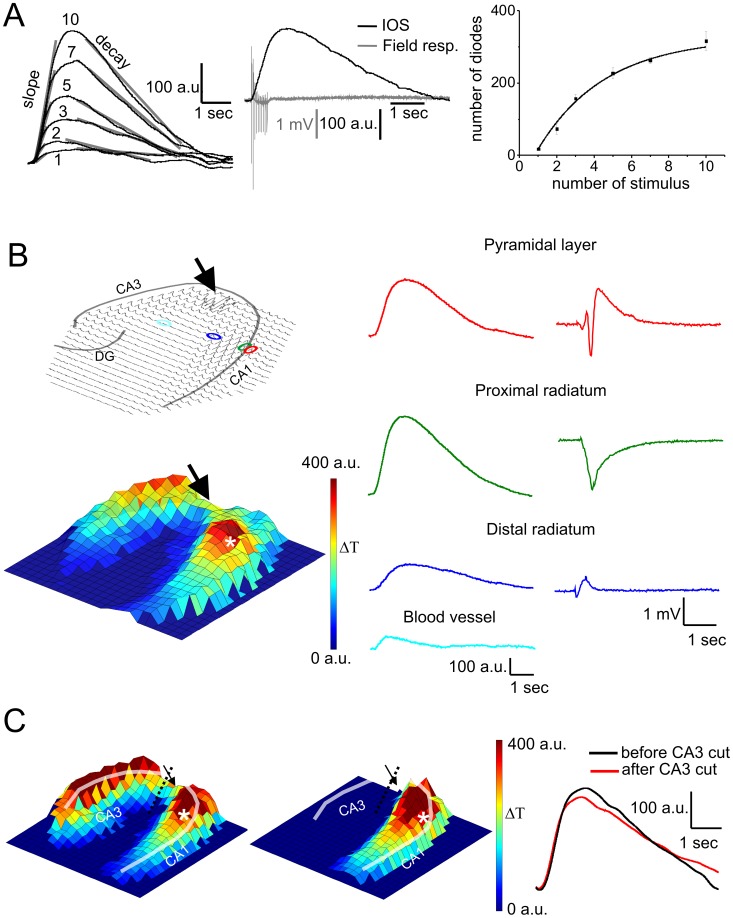
Figure 1. Time course, stimulation dependency and regional distribution of IOS and field response.
A left: Changes of IOS shape and amplitude with the increasing number of stimuli. Numbers above that curves indicate the stimulus number. Transparent lines show the fitted linear function to calculate the slope and decay of the IOS curves. A middle: Time course of the IOS and field response A right: Correlation between the number of diodes containing IOS and the stimulus number (R2 = 0.99). B Top left: Overview of the IOS signal on the 464 element photodiode array. Transparent lines indicate the pyramidal cell layer and the granular cell layer of the dentate gyrus (DG). The position of the stimulating electrode is marked by an arrow and the sites of field potential recording electrodes are indicated by colored elipses. B Bottom left: 3D representation of the IOS amplitude. The position of the stimulating and recording electrodes are marked by an arrow and an asteriks, respectively. The colorbar indicates the transmittance change compared to the resting light intensity. B Right: Representative IOS and field response traces recorded at different locations of the slice. The exact location of the traces are indicated by the coloured elipses on the Top Left image. C Left and Middle: 3D IOS amplitude maps before (left) and after (middle) making a cut between the stimulating electrode and CA3. Transparent line indicates the pyramidal layer. The position of the stimulating electrode is marked by an arrow and the site of field potential recording is indicated by an asterisk. C Right: Representative IOS traces near the recording electrode (marked by white asterisk) before (black) and after (red) making a cut between the stimulating electrode and CA3. The slight difference between the curves is due to the slightly decreased electrophysiological characteristics after making cut.

