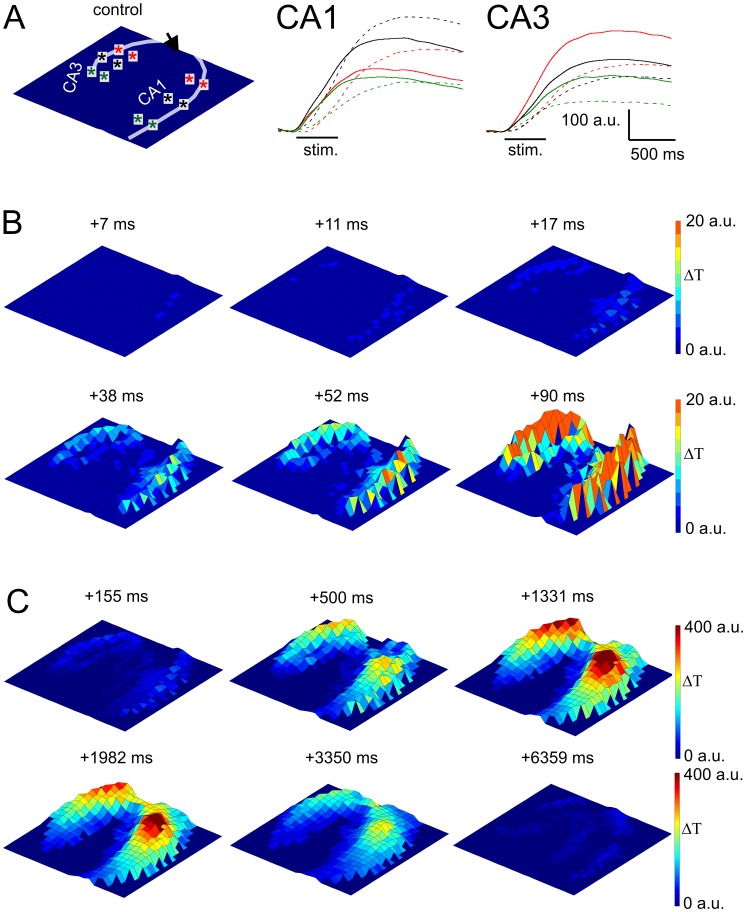
Figure 2. Temporal dissection of the IOS signal.
A Left: Orientation of the slice. Transparent line indicates the pyramidal layer and the arrow indicates the position of the stimulating electrode. A Middle and Right: Representative IOS traces from the CA1 and CA3 region respectively. The origins of the traces are indicated by colored asterisks on A left. Dashed lines indicate IOS traces originating from the str. radiatum. B: 3D IOS amplitude maps at different time points showing the spatial appearance of IOS in the first 90 ms following stimulus onset. The orientation of the slice is represented on A left. C: 3D IOS amplitude maps at different time points showing the spatial dynamics of IOS at a longer time-scale. The orientation of the slice is represented on A left. The colorbar indicates the transmittance change compared to the resting light intensity.

