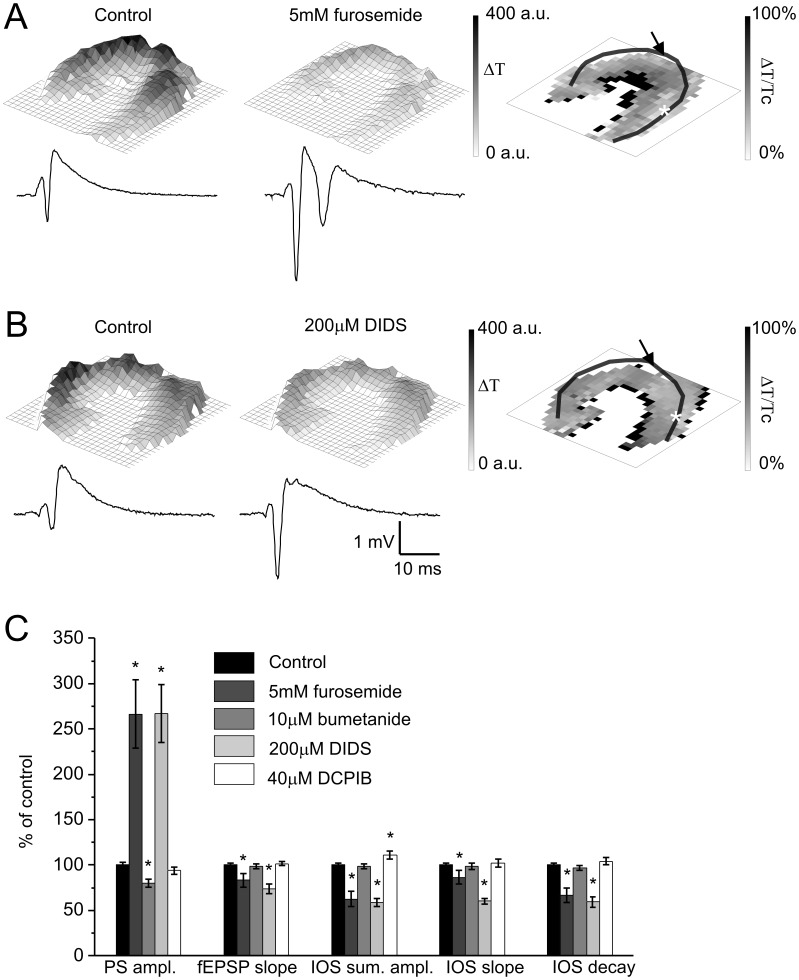
Figure 5. Neuronal K+/Cl.
− cotransporter, non-specific Cl − and volume-regulated anion channels contribute to IOS. A Left and Middle: Representative IOS amplitude map and field response curve under control condition and 5 mM furosemide application, respectively. The colorbar indicates the maximum change of the transmittance compared to the resting light intensity. A Right: Spatial visualization of the percentage of control changes of IOS signal caused by furosemide application. B Left and Middle: Representative IOS amplitude map and field response curve under control condition and 200 µM DIDS application, respectively. The colorbar indicates the maximum change of the transmittance compared to the resting light intensity. B Right: Spatial visualization of the percentage of control changes of IOS signal caused by DIDS application. C: The effect of 5 mM furosemide, 10 µM bumetanide, 200 µM DIDS and 40 µM DCPIB on the field response and IOS parameters in percentage of control. Asterisks indicate significant changes compared to control (P<0.05 Mann-Whitney U test, N = 5−8). Transparent lines on panel A, B right indicate the pyramidal cell layer. The position of the stimulating and recording electrode are marked by an arrow and asteriks, respectively.

