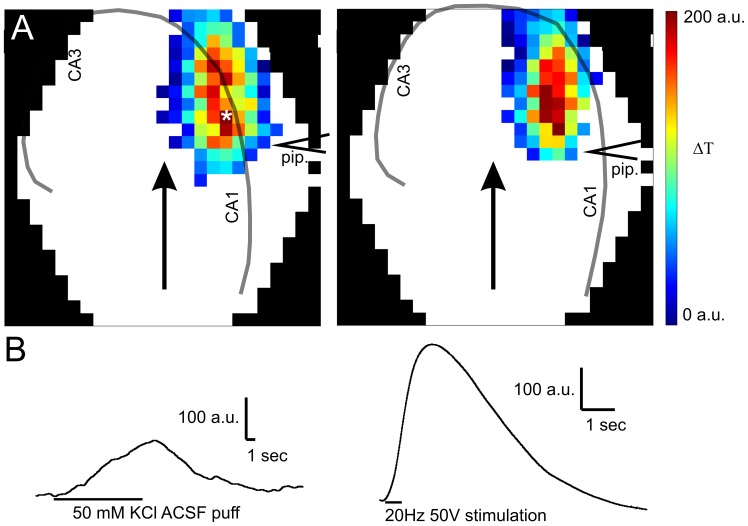
Figure 6. Spatial and temporal patterns of elevated [K+]-evoked and afferent stimulation evoked IOS are significantly different.
A: IOS amplitude maps after application of elevated [K+] ACSF ([K+] = 50 mM) onto the surface of the slice in the str. oriens (Left) or in the str. radiatum (Right) from a patch pipette. The position of the patch pipette (pip.) is indicated by the symbol “<”. Transparent lines indicate the pyramidal layer and the arrow indicates the direction of the buffer flow. The colorbar indicates the maximum change of the transmittance compared to the resting light intensity. B: Comparison of the shape of representative IOS traces evoked by elevated [K+] (Left) and afferent stimulation (Right) at the site marked by asterisk in A.

