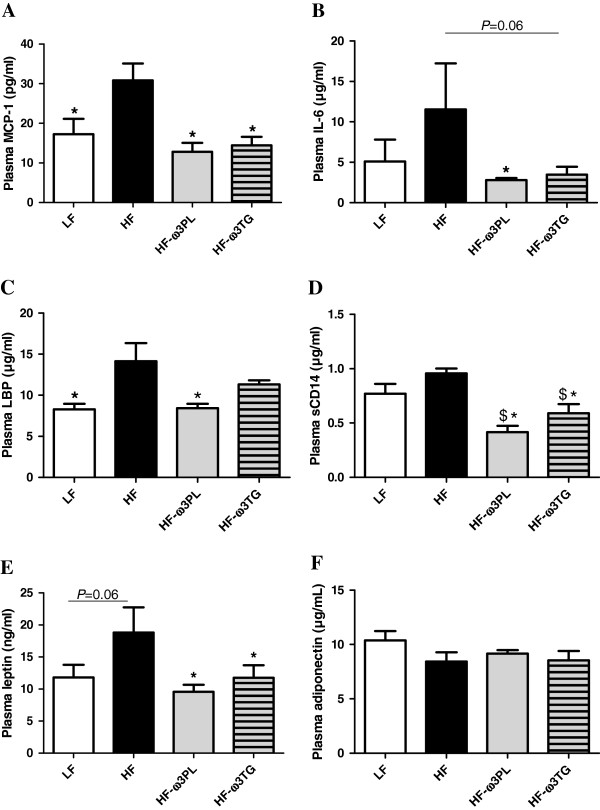
Figure 2.
Inflammation and endotoxin metabolism parameters in plasma of mice fed different diets. (A) monocyte chemoattractant protein-1 (MCP-1; pg/ml); (B) Interleukin-6 (IL-6; μg/ml). (C) lipopolysaccharide binding protein (LBP; μg/ml). (D) (soluble cluster of differentiation 14 (sCD14; μg/ml). (E) leptin (ng/ml); (F) Adiponectin (μg/ml). Data are means ± SEM (n = 6-8). (*P < 0.05 vs HF); ($P < 0.05 vs LF). ANOVA followed by Fisher test.

