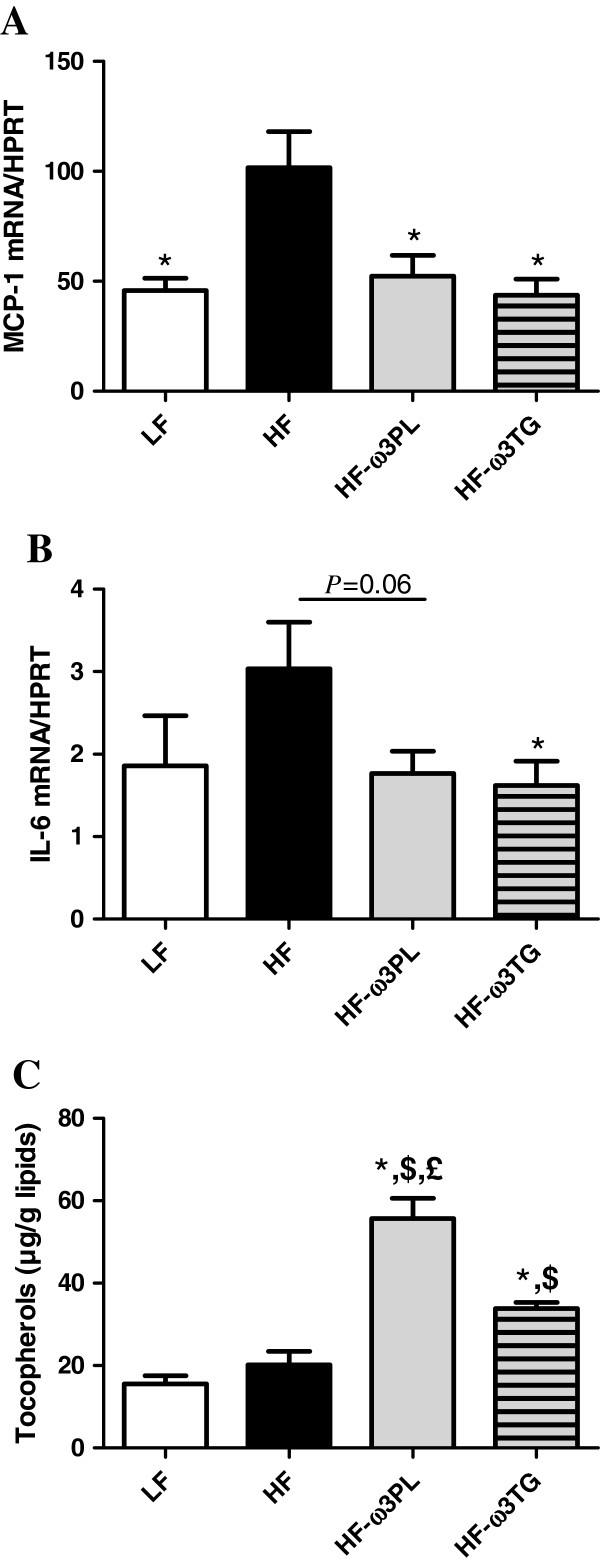
Figure 3.
Inflammatory markers and tocopherol level in epididymal white adipose tissue (eWAT). MCP1 mRNA (A); IL-6 mRNA (B) and Tocopherol (μg/g lipids) (C). RT-quantitative PCR results of mRNA expression. Tocopherol level was measured as described in Materials & Methods. Bars represents means ± SEM of n = 5-6 mice. (*P < 0.05 vs HF); ($P < 0.05 vs LF); (£P < 0.05 vs HF-ω3TG). ANOVA followed by Fisher test.

