
Figure 5.
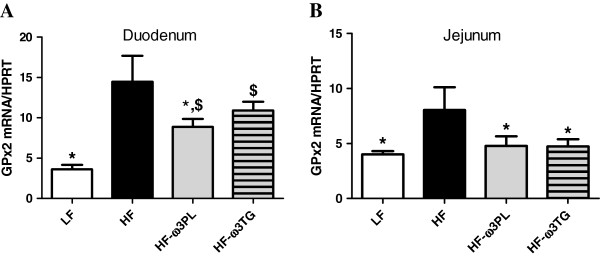
Expression of gastro-intestinal glutathione peroxidase 2 (GPx2) RNA in the small intestine. (A) duodenum and (B) jejunum of mice fed LF, HF, HF-ω3PL and HF-ω3TG diets during 8 weeks. This analysis was quantified by qPCR. Bars represents means ± SEM of n = 5-6 mice. (*P < 0.05 vs HF); ANOVA followed by Fisher test.