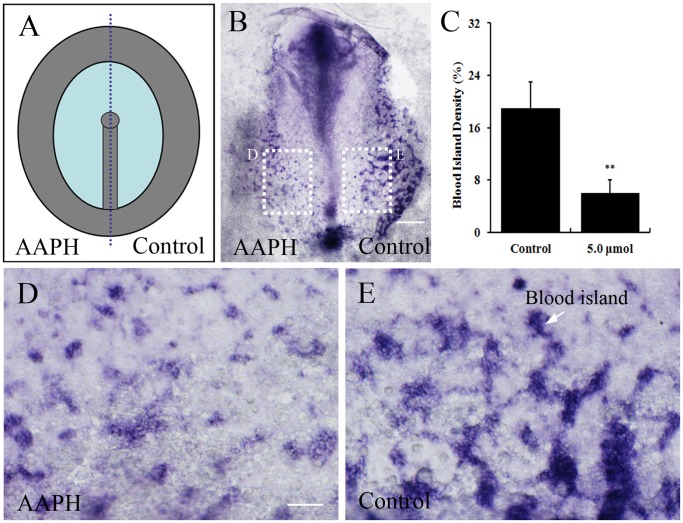
Figure 4. Effect of AAPH on blood islands formation in early chick embryos.
(A) Schematic illustration of primitive streak stage chick embryos treated with AAPH (left side of embryo) and saline (right side of embryo). (B) In situ hybridization of whole-mount chick embryo revealing VE-Cadherin expression and extent of blood island formation. (C) Statistical chart showing the blood islands density of AAPH (5.0 µmol) treated and untreated sides of embryos. Results presented as mean ± S.D (n = 10). Data analyzed using SPSS13.5 software, **p<0.01 compared with control. (D) Magnified appearance of blood islands (white arrow) of left side of embryos treated with AAPH and (E) right side with saline. Scale bars = 1 mm in B and 100 µm in D–E.

