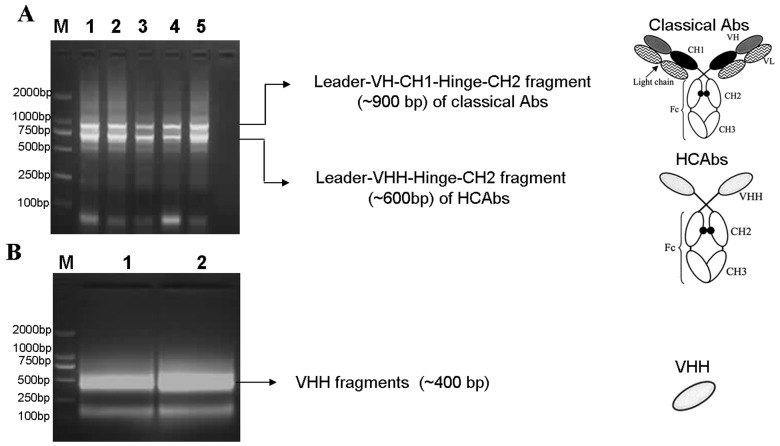
Figure 3. Agarose gel electrophoresis of Camelus Bactrianus VHH repertoire amplified by two successive PCRs.
A, First round PCR to distinguish VH from VHH based on amplicon sizes. The upper bands in lanes 1–5 (∼900 bp) represent the Leader-VH-CH1-Hinge-CH2 region of classical Abs. The lower band (∼600 bp) in lanes 1–5 represents the Leader-VHH-Hinge-CH2 region of HCAbs. B, The complete VHH fragments is amplified (∼400 bp in lanes 1–2) by a second nested PCR using the purified 600 bp DNA from Figure 3A as template. M in A and B indicate the DL2000 DNA marker. The primers used in two successive PCRs are from Table 1, and the schematics on the right of Figure 3A and Figure 3B represent the classical Abs (top), HCAbs (middle), and VHH (bottom).

