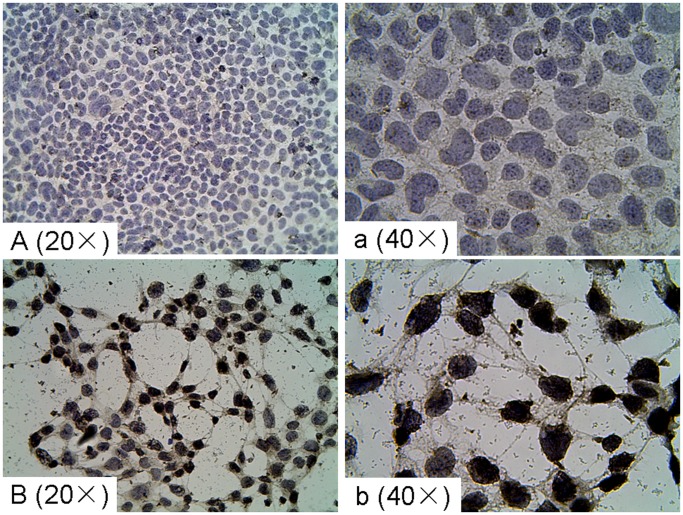
Figure 8. Immunocytochemistry analysis with VHH3 mAb.
A and a, mock-infected FPRC cells; B and b, PCV2-infected FPRC cells. All cells were examined under an inverted light microscope. The expression of PCV2 Cap protein is visualized as a brown color in the nucleus, and cell nuclei stained with hematoxylin are shown in blue in the mock-infected FPRC cells. In PCV2-infection group, most of infected cells had already detached and lysed. So the cell coverage was much less than mock control.

