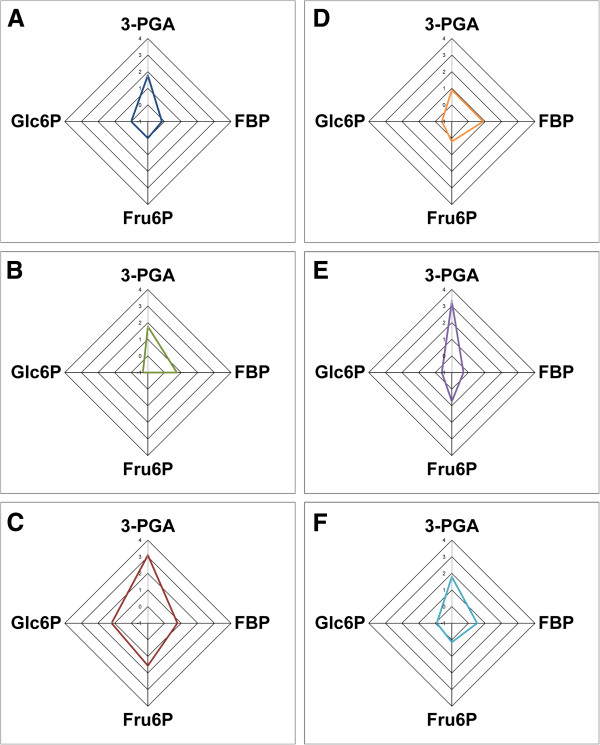
Figure 2.
Radial plots of the specificity constants for the activators. Plots were constructed using the log10 of the specificity constants for 3-PGA, FBP, Fru6P, and Glc6P obtained with different ADP-Glc PPases (see Table 1). (A) Anabaena, (B) OtaS/OtaL, (C) StuS/StuL, (D) OtaS, (E) OtaSD148A/OtaL, and (F) OtaS/OtaLD171A.

