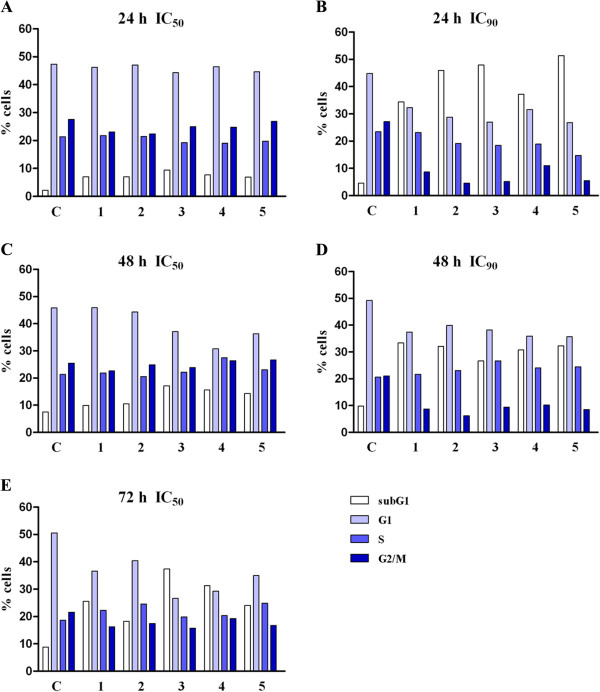
Figure 4.
Changes in the cell cycle phase distribution of HeLa cells induced by the Helichrysum zivojinii extracts after 24 (A,B), 48 (C,D) and 72 h (E) treatment (applied concentrations of tested extracts corresponded to IC50 and IC90 values determined for 72 h). (C- control HeLa cells, 1 – 5 – corresponding extracts are numbered consecutively). Representative graphs are shown.

