
Figure 3.
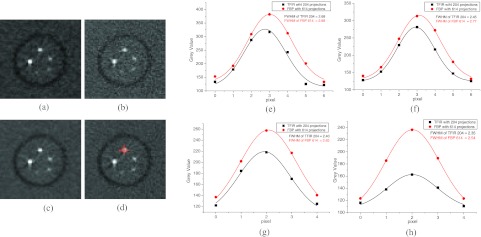
Images of a high-resolution phantom (Al wires insert) reconstructed using TFIR and FBP with 204 projections, (a) and (b), respectively, and with 614 projections, (c) and (d), respectively. The images were adjusted to the same window and level. Crossed lines in (d) indicate the regions for the line profiles. The line profiles for TFIR with 204 projections and FBP with 614 projections for 4 Al wires with diameters of 1630, 1290, 1020, and 813 μm are shown in (e), (f), (g), and (h), respectively.