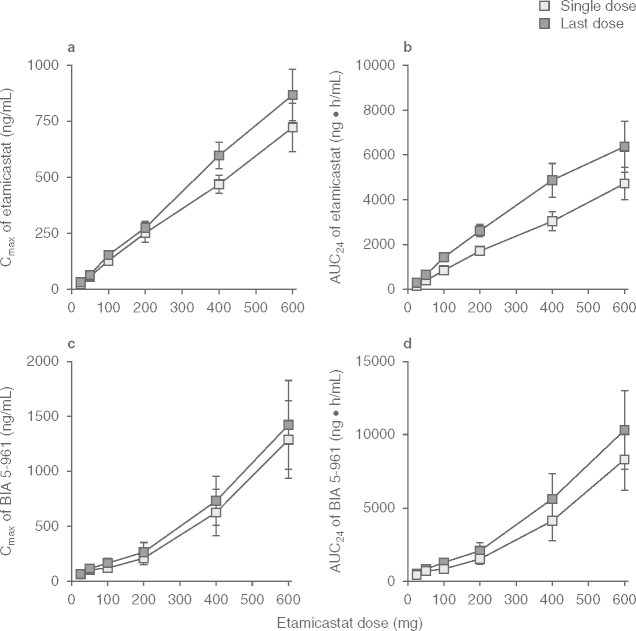
Fig. 5.
Maximum plasma concentrations (Cmax) and area under the concentration-time curve from time 0 to 24 hours (AUC24) values (mean ± SEM) of ( and b) etamicastat and (c and d) BIA 5-961 following single (day 1) and repeated (day 10) oral once-daily administration of etamicastat in the dose range 25–600 mg (etamicastat 200 mg: n = 12; other dose groups: n = 6 per dose group).

