
Fig. 3.
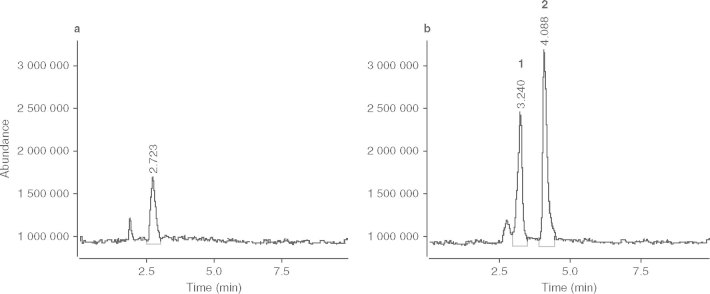
Chromatograms of (a) blank urine and (b) urine collected 4 hours after administration of tribendimidine. Peaks 1 and 2 in (b) correspond to the peak retention times of acylated p-(1-dimethylamino ethylimino) aniline (dADT) and dADT, respectively (see figure 4 for more detailed analysis).