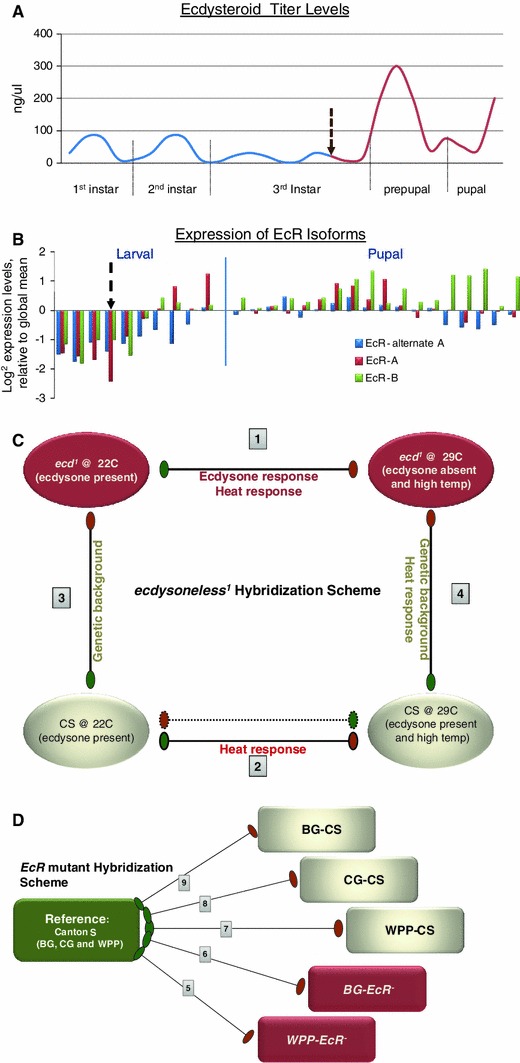
Fig. 1.

Overview of experimental design for ecdysone and Ecdysone Receptor (EcR) transcriptome responses. a Normal levels of 20-hydroxyecdysone pulses measured across larval and pupal stages. Dashed arrow indicates time point of temperature shift of ecd 1 mutants to restrictive temperature, removing all subsequent pulses of ecdysone. b Normal EcR expression during larval and pupal stages assessed by microarray analysis. Microarray probe isoform specificity is color-coded and indicated in legend. Dashed arrows indicate the time point where temperature rescue was ceased in EcR- mutants, effectively removing the expression of EcR. c Schematic of the ecdysoneless (ecd 1) hybridization experimental design, a modified round robin comparison. The samples include two wild type and two mutant (red) conditions. Each hybridization comparison is numbered for clarity of discussion in the text. The measured variables from each comparison is indicated and were used in our mixed model ANOVA to resolve the ecdysone-specific response, confounded by heat from the temperature shift and genomic background from the control CS samples. d Schematic of the EcR- hybridization experimental design, a global reference comparison. The reference (green) includes the pooled wildtype CS samples from Blue Gut (BG), Clear Gut (CG) and White Prepupae (WPP) stages. The experimental samples include three wildtype samples and two mutant samples (red), rescued up to BG and WPP stages. (Color figure online)
