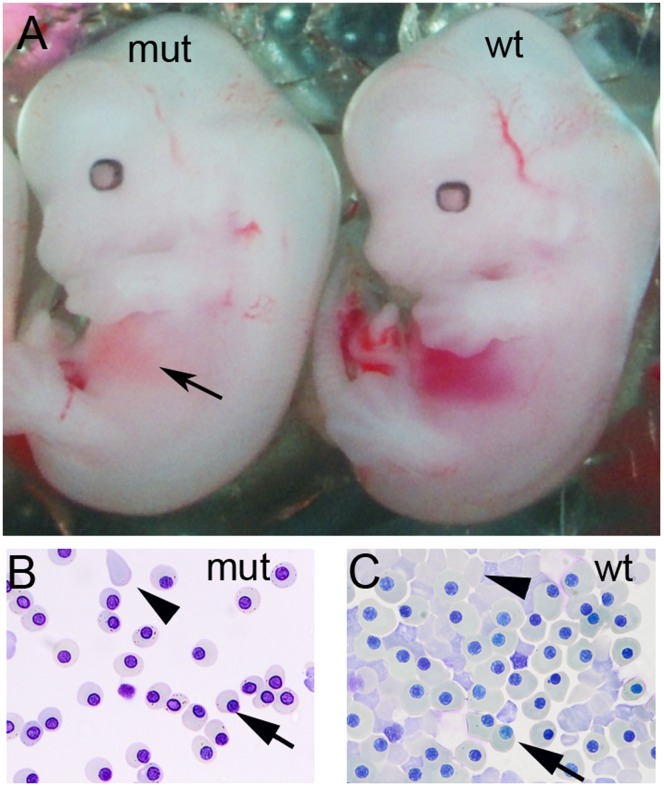
Figure 4. Anaemia in Lig1 mutants.
(A) A Lig1 mutant (mut) with pale orange liver (arrow) compared to the red haemoglobin rich liver of a wildtype (wt) littermate. (B, C) Analysis of peripheral blood in E13.5 embryos by cytospin and Giemsa staining (x40). (B) Lig1 mutant (mut) peripheral blood shows a high proportion of nucleated erythroblasts (arrow) to enucleated erythroblasts (arrowhead) compared with (C) a wild type (wt) littermate.

