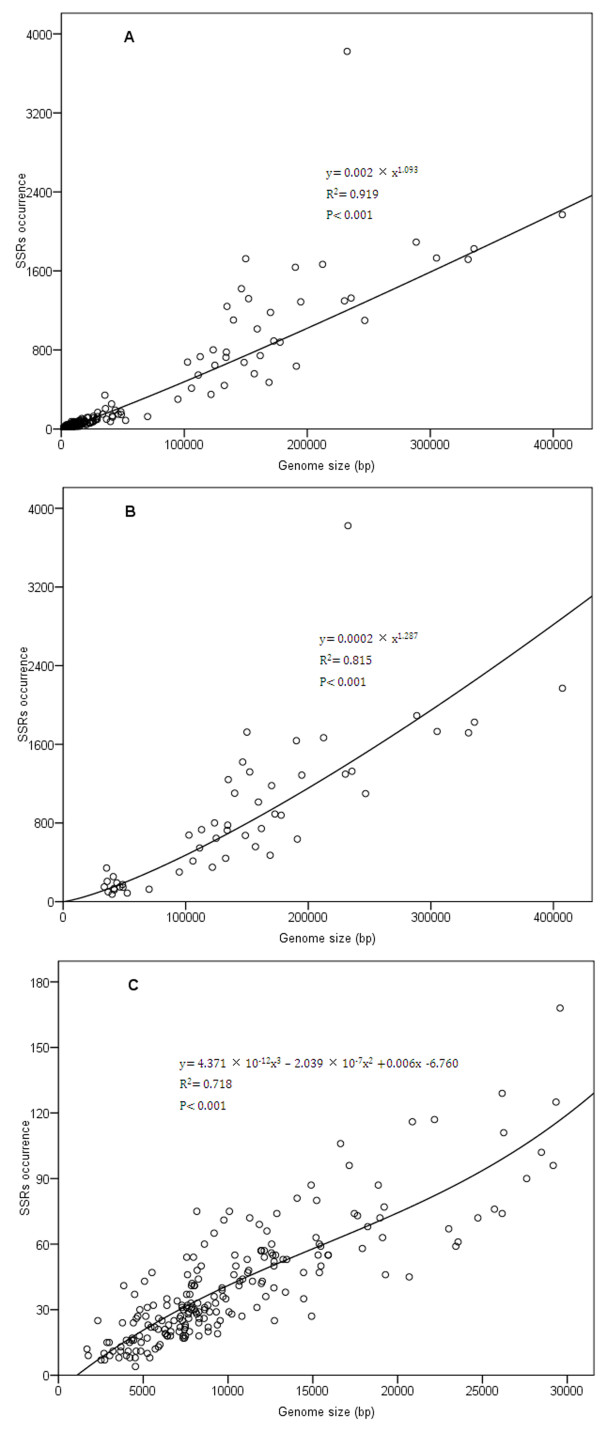
Figure 2.
Regression analysis of relationship between SSRs occurrence and genome size. (A) Scatter plot of SSRs occurrences in all analyzed virus genomes. (B) Scatter plot of SSRs occurrences in analyzed virus genomes > 30000 bp. (C) Scatter plot of SSRs occurrences in analyzed virus genomes < 30000 bp.

