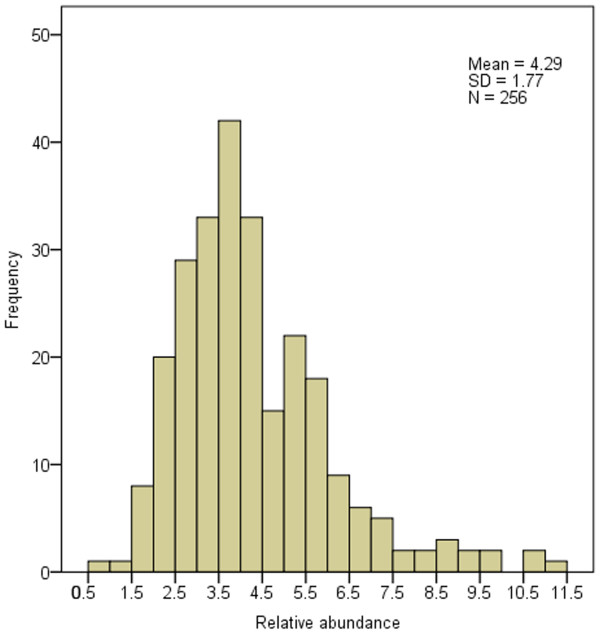
Figure 4.
Histogram of SSRs relative abundance. The horizontal axis represents the relative abundance of SSRs in all analyzed virus genomes. The vertical axis represents the genome frequency with the corresponding SSRs relative abundance. The definition of relative abundance of SSRs can be seen in MATERIAL AND METHODS.

