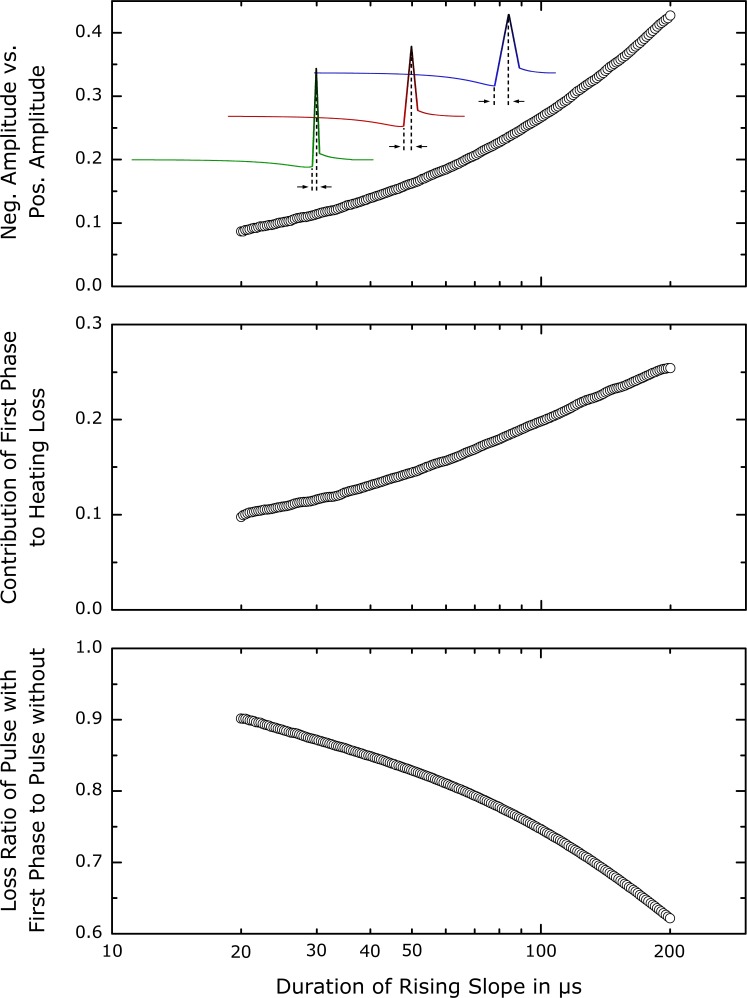
Figure 4. Role of the first phase in the optimal waveforms.
The ratio of the negative current amplitude to the subsequent positive peak is shown in the top plot. The x-axis gives the length of the rising current slope (see inlay) which is equal to the duration of the positive voltage phase. As the pulse duration is increased for lower maximum coil voltage, the amplitude of the first phase rises relative to that of the second phase. The contribution of the first phase to ohmic losses (middle plot) is not constant, but increases with pulse duration. Although it amounts to a substantial portion of the total loss, the first phase is advantageous especially for long pulses as the bottom plot demonstrates. The waveform incorporating the first phase produces approximately two thirds of the energy loss at rise times around 200 µs compared to the same pulse without the first phase, both evaluated at their individual excitation threshold.

