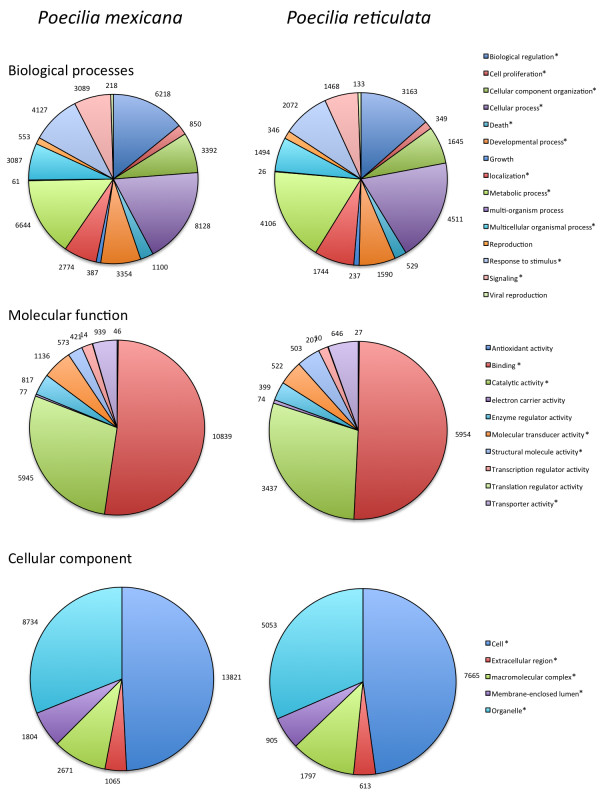
Figure 2.
Blast2GO assignment for 17,286 P. mexicana and 9,721 P. reticulata sequences. Significant differences in the frequency of different categories are highlighted with an asterisk. The numbers next to each colored slice of the pie chart represent the number of genes in the respective category.

