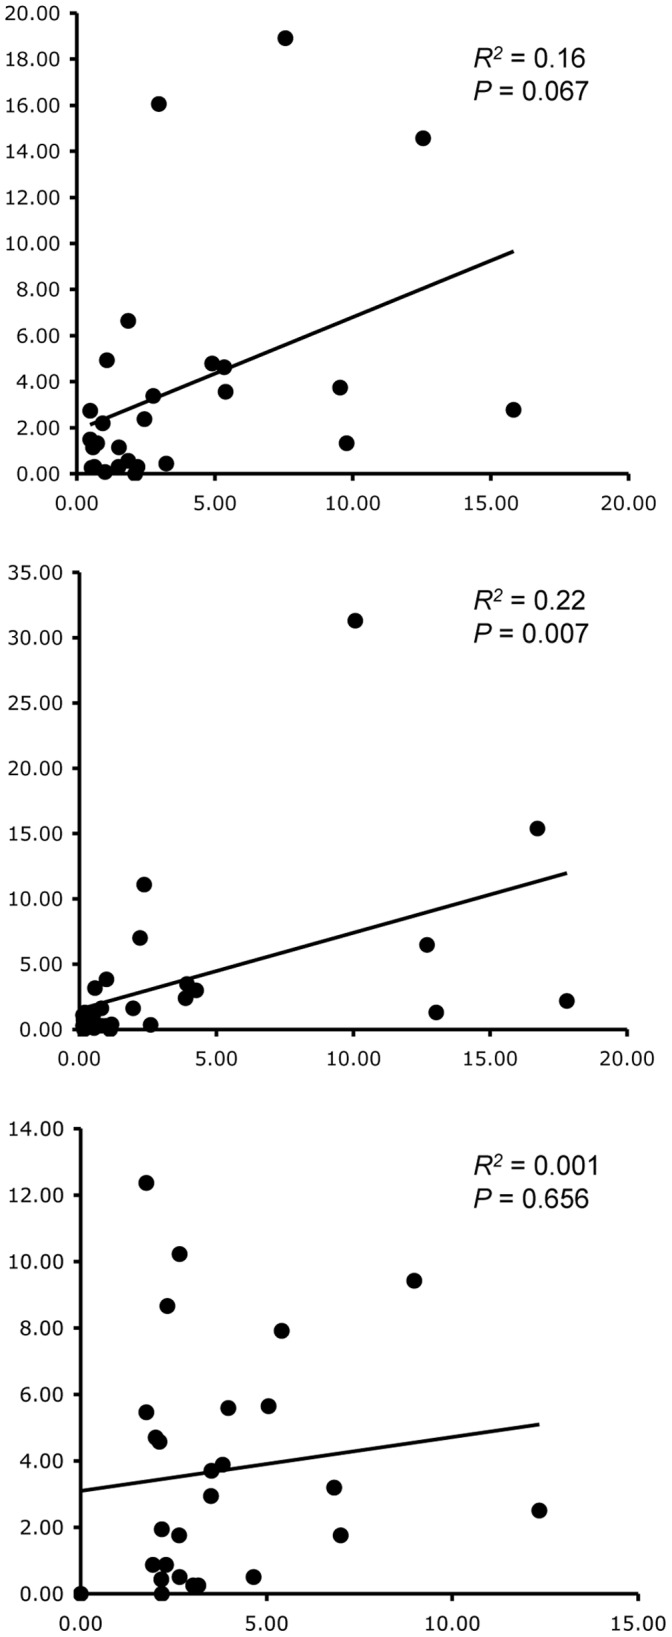
Figure 2. Regression analyses of the percentage of collembolan mtDNA COI sequences within an MID tag pool (y axis) against the percentage of genomic template from which they are derived within an experimental genomic pool (x axis).

Data come from Table S1. The panels from top to bottom are MID1 against pool 1, MID4 against pool 2, and MID7 against pool 3.
