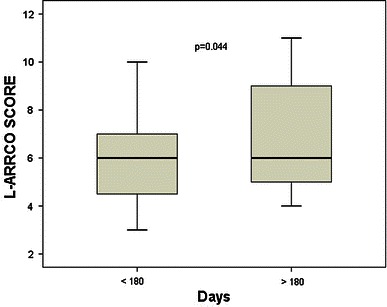
Fig. 2.

Box plot of the L-ARRCO scores for the two groups analyzed: <180 days (patient healed), >180 days (patient suffered delayed healing). The horizontal line in thebox indicates the median, the box indicates the standard deviation, and the vertical bars indicate the confidence interval at 95 %. The p value indicates the comparison between the two groups using Student’s t test
